

Operational performance metrics hr dashboard snapshot presentation images






Try Before you Buy Download Free Sample Product
 Impress Your
Audience
 100%
Editable
 Save Hours
of Time


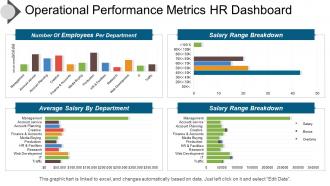
Measure your business efficiency with this technically developed and researched PPT template on the concept of operational performance metric HR PPT image. It simply allows your management to measure your human resource performance levels. Thus, define the parameters of HR efficiency with this info graphically PPT image. The metrics are salary, employees working in the department, average length of service, average retirement age and more. Represent the relevance of such metrics evaluation with this HR metrics PPT layout diagram. Such as, it helps in building an effective and employee oriented working environment which helps in retaining your employees. It also helps in reducing your employee turnover rate also. You can also develop and create some competent HR strategic and policies depending upon your HR metrics evaluations and also on the basis of your business overall performance. Start customizing this exclusive PPT image design in accordance to your HR strategy design of your entity. Click on the download option given below. Continue to achieve with our Operational Performance Metrics Hr Dashboard Presentation Images. They help guard against disappointments.
People who downloaded this PowerPoint presentation also viewed the following :
Operational performance metrics hr dashboard snapshot presentation images with all 5 slides:
Concepts evolve with our Operational Performance Metrics Hr Dashboard Snapshot Presentation Images. They give your thoughts a fresh angle.


FAQs for Operational performance metrics hr dashboard
Honestly, start with the basics - turnover rate, time-to-hire, and employee satisfaction scores. Those three will tell you the most. Add headcount by department and absenteeism rates too. Training completion percentages are pretty useful. Diversity metrics matter if your company cares about that stuff (and they should). Performance review completion and internal promotion ratios round it out nicely. But here's the thing - don't go crazy with like 15 different metrics. Pick maybe 6-8 that actually matter to your goals. I've seen dashboards that are just complete information overload. Keep it simple at first.
Look, HR metrics are basically your early warning system for retention issues. Track engagement scores and exit interview patterns - you'll start seeing where people bail and why. The crazy part? You'll notice weird trends like everyone leaving at the 18-month mark or certain departments bleeding talent. Honestly, most companies are flying blind on this stuff. Pull your turnover data by department first - that shows you the biggest problem areas immediately. Then you can actually fix what's broken instead of just hoping people stick around.
Think of engagement data as your company's mood ring - it tells you who's actually bought in versus who's mentally checked out. Survey scores and response rates show up on your dashboard, plus you can track sentiment over time. Honestly, this stuff matters way more than most people realize because engaged workers don't quit as much and they actually give a damn about their work. You can catch red flags early too, like when one department's scores tank or everyone starts getting grumpy at once. Perfect for figuring out which fires to put out first.
Honestly, HR dashboards are total game-changers for recruitment. You get all your important stuff in one spot - time-to-fill, cost-per-hire, which job boards actually work. Before I had one, I'd waste so much time digging through different systems for basic numbers. Now? Everything's automated. The coolest part is spotting trends fast. Like when you realize LinkedIn brings way better candidates than Indeed (sorry Indeed). Set up those auto-reports for your managers too - saves you from the constant "hey, how's that hire going?" messages. Seriously makes the whole process less chaotic.
So turnover rate is like your early warning system - shows how many people are bailing vs your total headcount. High numbers? Usually means management sucks, pay is garbage, or the culture's toxic. Companies that ignore this always end up panicking later when half their team quits. Track it by department though, not just overall averages - that's where you'll actually spot problems. Oh and set up monthly tracking so you can jump on issues before your rockstars decide they're done with the BS.
Honestly, visualization tools are game-changers for making sense of your data. You'll spot turnover patterns instantly instead of hunting through endless spreadsheet rows. Like, which departments are losing people? When do hiring spikes happen? It's all right there visually. Way better than staring at numbers until your eyes bleed. Charts show trends and weird outliers you'd never catch otherwise. Plus - and this matters more than it should - executives actually look at dashboards. Drop an Excel file on them and watch their eyes glaze over immediately.
Mix hard numbers with the softer stuff - that's what actually works. Goal completion rates and productivity metrics are obvious ones. But honestly, peer feedback tells you way more than attendance records ever will. Quality assessments matter too, plus any skill development or training progress they're making. If you do 360 reviews, those scores are gold. I'd probably start small though - pick maybe 3 or 4 key things per person instead of trying to track everything. You'll burn out otherwise. The collaboration piece is tricky to measure but super important for team dynamics.
So basically, HR dashboards show you which skills your team has vs what you actually need - like a heat map that makes the gaps obvious. Filter by department or role to see where you're screwed. Honestly, the coolest feature is tracking if your training programs are even working (spoiler: half the time they're not). I'd focus on dashboards that let you sort by critical skills for upcoming projects. That way you're not wasting training budget on random stuff. Makes it way easier to see completion rates too.
Honestly, tracking diversity metrics consistently is what actually moves the needle on culture change. It makes your inclusion work visible and keeps leadership honest. Don't just count heads though - look at promotion rates, pay gaps, retention by group. That's where the real story lives. The data creates transparency that gets people talking and helps you spot bias patterns. I'd start with maybe 3-4 metrics that match what you're trying to achieve culturally, then review monthly with leadership. Makes it harder to sweep issues under the rug when everyone's looking at the same numbers.
Dude, real-time data is clutch because you catch issues while you can actually fix them. Like, you'll see turnover spikes happening right now instead of reading about it in some useless quarterly report three months later. Monitor which departments are bleeding talent, or notice your best people getting stuck without promotions. Honestly way better than playing catch-up all the time. You can jump on problems immediately - maybe there's a toxic manager driving people away, or you need to promote someone before they bail for another company. I'd start with like 3-5 daily metrics and go from there.
Honestly, the data mess is gonna be your biggest headache. Your HRIS and payroll systems hate each other, so you're stuck with incomplete info everywhere. Then there's the whole "what even IS employee engagement?" problem - these metrics are weirdly hard to pin down. Privacy stuff gets complicated fast too since you're handling people's personal data. Oh, and don't get me started on trying to measure "time to productivity" consistently. My take? Pick maybe 3-4 metrics you actually trust the data on. Build those out first, then expand once you're not drowning in messy spreadsheets.
Look, pay transparency is everything for keeping people happy. Track your salary benchmarks against market rates and watch for internal pay gaps - you'll catch problems before good people start looking elsewhere. Short sentences hit different sometimes. Nobody wants to feel like they're getting screwed compared to their teammates (been there, not fun). Pull up those compensation ratios during review season and fix the outliers early. Way better than having someone tell you in their exit interview that they found out Sarah was making 20% more for the same work. Your dashboard should flag these issues so you're not always playing catch-up.
Okay so three things that'll save your sanity. Start with automated validation rules - they catch weird stuff like hire dates coming after promotions (trust me, happens way too often). Monthly spot-checks are huge too. Just sample some records and compare them to your source systems. Oh and train whoever's entering data on your standards - sounds boring but it works. Honestly? Those validation rules upfront are worth their weight in gold. They'll stop most errors before they tank your reports.
So basically, you layer predictive analytics over your current HR data to spot trends before they hit. Like, instead of just seeing turnover numbers, you'll know which employees might bail based on their engagement scores and performance patterns. Honestly, it's pretty wild once you get the hang of it. Start with something simple though - maybe just turnover prediction first. From there you can expand to hiring forecasts, skill gaps, team burnout risk, all that stuff. I'd avoid trying to do everything at once because it gets overwhelming fast.
So absenteeism numbers actually reveal way more than you'd think. Burnout, crappy managers, toxic culture - it all shows up there. I always look for department patterns first because if one team's constantly out, something's definitely wrong. The really useful part? Cross-reference it with engagement surveys or turnover data. You'll start seeing connections everywhere. Track monthly trends and investigate any weird spikes that aren't just flu season. Honestly, it's like workplace detective work once you get into it.
-
Colors used are bright and distinctive.
-
Great designs, Easily Editable.