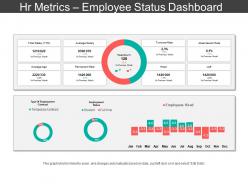
Hr metrics employee status dashboard snapshot ppt slide templates
Try Before you Buy Download Free Sample Product
Audience
Editable
of Time
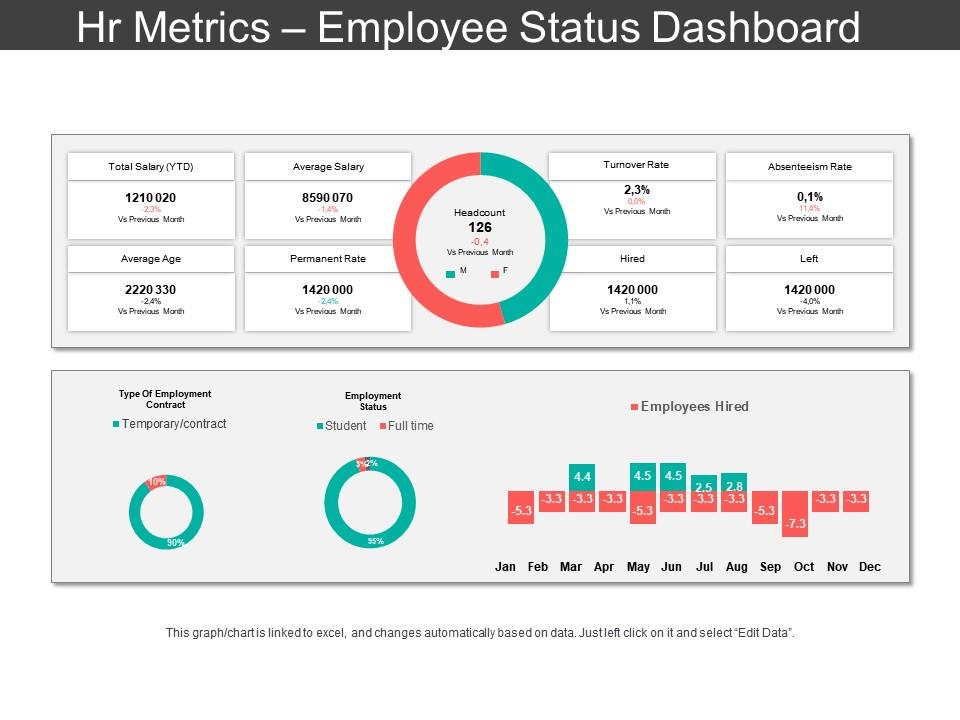
Measure the cost and the impact of employee programs by using HR Metrics Employee Status Dashboard Snapshot PPT Slide Templates. You can determine the areas of human resources such as turnover, training, return on human capital, costs of labor, and expenses per employee with the help of this HR induction presentation template. Use the human resource orientation PowerPoint graphic to showcase the work of HR like- to improve the recruiting process, optimize the workplace management, and to enhance the overall performance of the individual employee. Employ the performance indicator PPT slideshow to highlight all the business-related norms such as attendance portal, leaves and holidays, office timings, and office dress code. Take the assistance of our employee engagement PowerPoint layout to generate a report on the number of employees hired and the entire employment status of the organization. Hence, uphold every employee information by downloading our ready-to-use human resource management system PPT theme.
People who downloaded this PowerPoint presentation also viewed the following :
Hr metrics employee status dashboard snapshot ppt slide templates with all 5 slides:
Ready for your next presentation? Our Hr Metrics Employee Status Dashboard Snapshot Ppt Slide Templates are here to make sure that you are.
FAQs for Hr metrics employee status dashboard snapshot
Start with employee turnover, time-to-fill, and engagement scores - they'll give you the clearest picture of what's actually happening. Absenteeism and cost-per-hire are solid too for tracking productivity and spending. Honestly, most HR teams I know get obsessed with tracking everything and then never look at half of it. You don't need 20 dashboards right now. Pick maybe 5-7 metrics that you'll actually check monthly and use to change things. Once you've got those dialed in, you can get fancy with stuff like manager-specific retention rates. But seriously, keep it simple at first.
Look, having solid HR data is a game changer because you're not just making decisions based on hunches anymore. Track stuff like turnover rates and how long it takes to fill positions - you'll start seeing patterns that would've flown under the radar otherwise. Say your top people keep bailing after a year and a half... that's telling you something's up. Plus, when you need budget approval from the higher-ups, actual numbers make your case way stronger. Hard to argue with "this tool will slash our hiring costs by 30%." Honestly, just pick 3-4 metrics that align with what your company actually cares about and start there.
Employee engagement is like your early warning system for everything else going wrong. Low scores? You'll start seeing people quit more, call out sick constantly, and performance reviews will tank. I always tell people it's way better than waiting for the damage to show up in other metrics first. You can actually predict problems before they get expensive. Just compare your engagement survey results with turnover and performance data - the patterns are usually pretty obvious once you look. Honestly, most companies miss this connection and then act surprised when half their team quits.
Start with tracking where people bail - phone screens? Final interviews? That's usually your biggest clue. Time-to-hire and cost-per-hire are obvious ones, but honestly the best thing you can measure is which job boards actually work vs just flood you with garbage applications. Most places never figure that out somehow. Quality of hire takes forever to measure but it's worth it. Also check your offer acceptance rates - if they're low, something's wrong earlier in the process. Pick maybe 3-4 metrics that match whatever's driving you crazy right now and review monthly.
Oh man, first thing - figure out what you actually need before drowning in data. I learned this the hard way lol. Focus on stuff that matters to the business like retention rates or how long it takes to fill positions. Clean up your data sources because nothing's worse than trying to make sense of random Excel files from 2019. Look at trends over months, not just one-off numbers. Break everything down by department or team - that's where you'll find the real insights. And honestly? Keep your dashboards super simple. Leadership doesn't want to decode some complex chart during their morning coffee.
Ugh, high turnover basically screws with everything else. Your recruitment costs go through the roof, and productivity tanks while new people get up to speed. Customer satisfaction usually drops too because nobody knows what they're doing. The people who stick around get burned out from constantly training replacements - I've been there and it sucks. Revenue per employee falls, you lose all that institutional knowledge when people walk out the door. Here's what I'd do: track how your turnover numbers line up with engagement surveys and quarterly performance. That'll tell you exactly where things are falling apart.
Look, HR metrics will show you exactly where people are bailing instead of you just throwing solutions at the wall. Pull your turnover data from the last year and dig into it by department or manager - you might find out your dev team always quits around the 18-month mark, or that one manager is basically a revolving door. Exit surveys are gold too. If everyone's complaining about pay but engagement scores look decent, boom - you know where to spend your money. Honestly, the patterns are usually way more obvious than you'd think once you actually look at the numbers.
Honestly, you need to look at both the numbers and the feelsy stuff. Get your demographic breakdown first - who's where across departments, leadership, pay levels. That's baseline. Retention and promotion rates by group are huge too. But here's the thing - surveys about inclusion and psychological safety will tell you way more about what's actually going wrong day-to-day than spreadsheets will. Exit interviews are pure gold. Oh, and track your hiring funnel diversity from applications through offers. I'd say pick like 5-7 metrics for a monthly dashboard so you can catch issues early.
Honestly, the biggest thing is getting rid of all that manual spreadsheet nonsense - we both know how error-prone that gets. Technology automates data collection from your HRIS and payroll systems, so you're not pulling numbers by hand anymore. Real-time dashboards let you spot patterns you'd totally miss otherwise. Calculations stay consistent too, which means your turnover rate actually means something from month to month. The cool part? Predictive analytics can flag flight risks before people actually quit. I'd start small though - maybe just one automated dashboard and see how it goes from there.
Look, HR metrics are basically how you figure out what's actually making your team productive. Track stuff like engagement scores, turnover rates, and how long it takes to hire people - you'll start seeing patterns that show up in performance. Here's the thing though - when engagement scores drop, productivity usually follows a few weeks later. It's weirdly predictable once you get the hang of it. Focus on employee satisfaction, how often people call out sick, and who's sticking around. Those give you a heads up before things go sideways. Honestly, just pick 3-4 metrics that make sense for your situation and check them monthly. Don't overthink it.
SHRM and Mercer put out solid benchmarking studies every year - that's where I'd start. They break down turnover rates, time-to-fill, all that good stuff. LinkedIn Talent Insights is pretty clutch for recruiting data too. Here's the thing though - don't compare your manufacturing company to some Silicon Valley startup because you'll just get depressed. Stick to similar size and industry. Maybe I'm overthinking it, but geography matters too since talent markets vary so much. Once you've got the numbers, just throw together a basic dashboard. Track your stuff against industry averages quarterly and you're golden.
So you know how numbers only tell half the story? Like, your turnover might be 15%, but that doesn't explain *why* people are leaving. Exit interviews might reveal it's actually terrible managers who never help anyone grow. Comments from surveys and just watching office culture - that's where the real insights are. Numbers show you what's broken, but feedback tells you how to fix it. I learned this the hard way when I kept staring at spreadsheets wondering why everything looked fine on paper but people were still miserable. Try running your next survey with both rating questions AND comment boxes - you'll be shocked at the difference.
Honestly, your HRIS probably has way more useful data than you think. Performance reviews and competency assessments will show you exactly where people are stuck. Training completion rates are gold too - see who's finishing what and who isn't. Here's something most people miss: check your internal mobility numbers. If nobody's moving up from specific departments, that's your smoking gun right there. Run everything against your business goals and industry standards to find the gaps. Oh, and don't sleep on promotion patterns - they tell you everything about skill bottlenecks.
Ugh, HR metrics can be such a pain to interpret properly. Context matters SO much - like high turnover looks terrible until you realize it's just seasonal workers. Data quality will drive you nuts because you're pulling from different systems that hate each other. The correlation vs causation thing trips up literally everyone (myself included). Engagement drops, productivity tanks - but what caused what? Surface numbers lie constantly. Always dig deeper and actually talk to the managers who know what's really happening day-to-day. Trust me on this one.
Monthly is usually your sweet spot for most HR stuff. Turnover and engagement scores definitely need that regular pulse check - catch problems before they spiral. But honestly? Some metrics like comp analysis or diversity numbers can wait til quarterly since they barely budge month to month anyway. Weekly makes more sense for the urgent stuff - time-to-fill, absenteeism, that kind of thing. Set up alerts when numbers hit your thresholds so you're not constantly staring at spreadsheets. Trust me, data overload is real and you'll miss the actual red flags.
-
Excellent template with unique design.
-
Presentation Design is very nice, good work with the content as well.