


Hr Dashboard Number Of Employees Employee Structure


Try Before you Buy Download Free Sample Product
 Impress Your
 Audience
Editable
of Time


Our Hr Dashboard Number Of Employees Employee Structure are a dependable ally. They uphold the trust placed in them.
People who downloaded this PowerPoint presentation also viewed the following :
Content of this Powerpoint Presentation
The busiest looking department of any organization appears to be so as they have their hands in a lot of pies. These employees are the ones to engage with the entire workforce, concern themselves with their well-being, and ensure the organizational name is well-reflected in the corporate circle. It's your friendly HRD or the Human Resource Department that acts as the house-keeping for the organization.
The HR’s inter-departmental role is crucial to keep the company wheels in sync. Among their crucial responsibilities, this department must also submit reports of their contribution from time to time. These HR reports are based on real-time and long-term data that are collected using dashboards. One such fully editable dashboard template is shared below.
Deploy this content-ready PPT Presentation to maintain track of employee structure, onboardings, offboardings, and retention over time.
Track employee tenures with this 100% editable PPT Design
Track salaries disbursed, revenue collected, and education spendings among other metrics to reveal the best image of your company. Let's check this PPT Layout now!
Template 1: HR Dashboard with Employee Structure
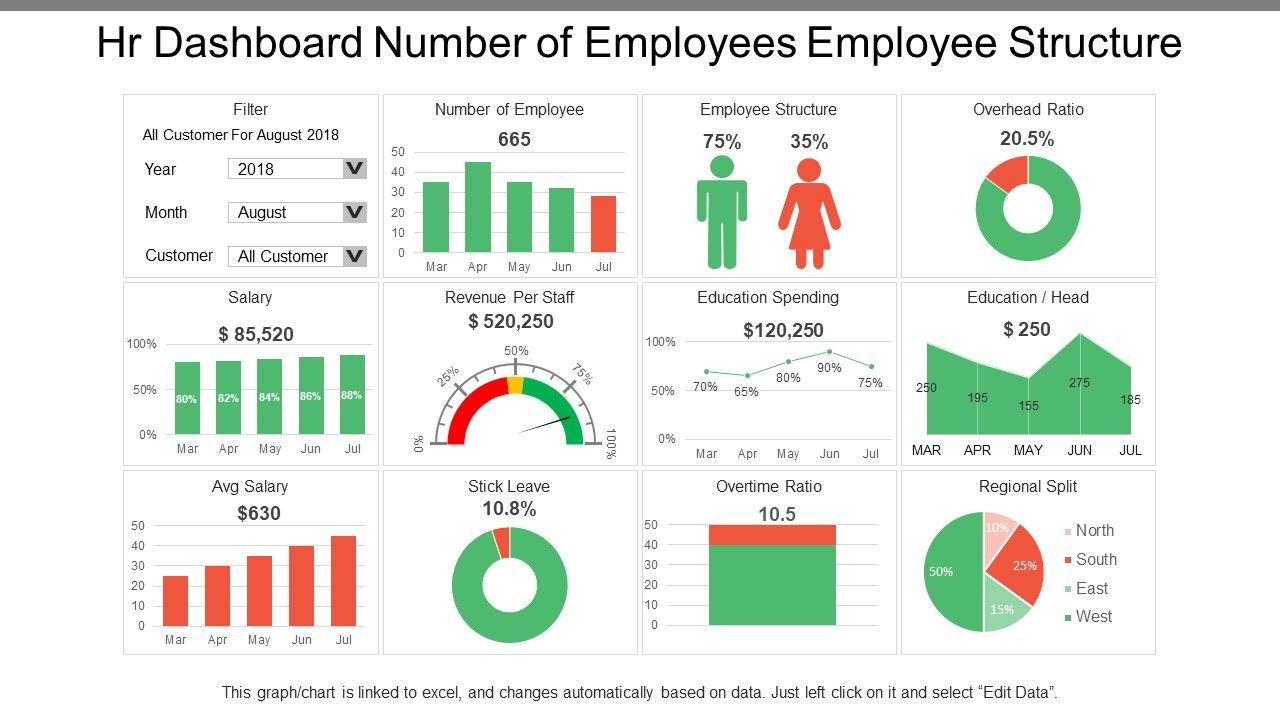
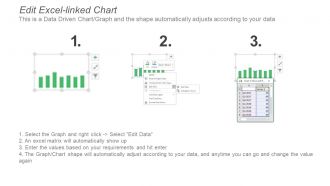
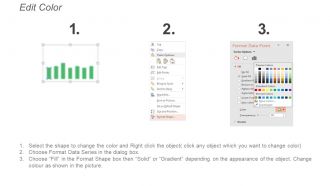
Showcase the employee structure within your organization with this practical dashboard design. This presentation design features Excel-linked graphs, pie charts and infographics that are 100% editable and easy to navigate. Popular metrics that can be monitored with this dashboard design are employee structure, overhead ratio, education spent, average salary etc. This PPT Dashboard can then be used in internal policy making as well as in external annual report generation. Download now.
PS: Monitor employee resignations over the years to understand the reasons and improve on those to improve retention using this PPT Preset.
Hr Dashboard Number Of Employees Employee Structure with all 6 slides:
Get a chance to introspect with our Hr Dashboard Number Of Employees Employee Structure. Analyze factors driving you forward.
FAQs for Hr Dashboard Number Of
Okay so definitely start with these basics - turnover rate, time-to-fill, satisfaction scores, and absenteeism. Cost-per-hire and training completion rates are solid too since leadership eats that stuff up. Revenue per employee is huge if you want to show actual business impact. Here's the thing though - dashboards get messy super fast when you try cramming everything in. I'd stick with those six metrics first. See what questions come up in meetings, then add more based on what people actually care about. Way better than building some massive thing nobody looks at.
Okay so basically an HR dashboard shows you what's really going on with your team in real-time. Survey scores, turnover rates, who's actually participating in company stuff - it's all right there instead of you just guessing. Honestly makes such a huge difference when you can see the actual numbers. Then you can figure out which departments are struggling or which managers are doing great. Oh and definitely set up alerts for weird trends - that way you catch problems early before they get messy. Way better than flying blind, you know?
Honestly, just stick to the basics - bar charts for headcount stuff, line graphs when you're tracking turnover trends, pie charts for diversity breakdowns. Heat maps are clutch for performance data across teams since you can spot patterns instantly. Don't overthink it with 3D nonsense that nobody can read properly. Blue should always mean the same thing throughout your dashboard, and only use red for the really urgent stuff. Put your most important metrics up top (obviously) and definitely test it with real people first. Trust me, what looks good to you might confuse everyone else.
Honestly, I'd go with daily updates for the big stuff - headcount, who showed up, new hires. Weekly works fine for things like training completions since those don't really move that fast anyway. Real-time is obviously the dream if your system can pull it off. Nothing's more embarrassing than citing old numbers in front of the C-suite, trust me on that one. Performance review data? Monthly's probably enough there. Really just depends on how fast things change and how often your boss needs to reference the numbers for whatever they're deciding.
Oh this is actually pretty sweet - predictive analytics turns your HR data into a crystal ball instead of just looking backwards. You can spot employees who might quit before they do, forecast when you'll need more hires, stuff like that. The cool part? You get to fix things early. Like if someone's showing flight risk signs, you can actually talk to them first. I'd honestly just pick one thing to start with - maybe turnover prediction since that's usually the biggest headache. Build from there once you get the hang of it.
So basically, HR dashboards show you all your diversity stuff in real time - gender, race, age breakdowns across departments and leadership. Instead of digging through a million different systems (ugh, the worst), you can see hiring ratios, promotion rates, and pay gaps all on one screen. Charts make it way easier to catch patterns you might miss otherwise. Oh, and you can actually set diversity goals and track if you're hitting them. Honestly, just pick your top 3-4 metrics first and go from there - don't overcomplicate it.
Oh man, data integration is going to be your biggest headache. All your HR stuff is probably spread across like 5 different systems and none of them talk to each other. Getting leadership on board early is crucial too - otherwise you'll build something amazing that nobody uses. Don't get stuck debating metrics forever (trust me, that rabbit hole is deep). Pick 3-4 metrics everyone can agree on and start there. Your team will need training on reading the data properly, but honestly? Better to have them asking questions than just nodding at colorful charts. Prove it works first, then expand.
So basically an HR dashboard shows you what's happening with hiring and who's quitting in real-time. No more Excel hell - it pulls everything from your hiring software automatically. You can track stuff like how long it takes to hire someone, which job sites actually work, and turnover by team. Honestly once you see it all laid out visually, patterns jump out at you fast. Like maybe one manager keeps losing people or Indeed isn't sending great candidates anymore. My advice? Pick your top 3-5 metrics first and build from there.
Put the daily stuff upfront - headcount, open positions, time-to-hire. That's what they'll actually look at. Don't go crazy with colors (seriously, rainbow charts are the worst). White space is your friend here. Group similar stuff together and make sure the big KPIs show up without scrolling. Interactive filters are a must so people can filter by department or whatever. Oh, and definitely test it with real HR people first - they always spot things you miss and will tell you exactly what sucks about it.
Dude, real-time data is seriously a game changer for HR stuff. You can actually see what's happening NOW instead of getting some useless report three weeks later. Like if people are suddenly quitting left and right, or your recruiting process is totally broken - you'll know immediately. Honestly wish I'd figured this out sooner! Quick decisions become way easier when you're not just guessing. Set up alerts for the metrics that actually matter to your team (not everything, trust me). Problems don't spiral out of control because you catch them early.
Tableau and Power BI are probably your best bets - everyone's using them. Excel works too but gets ridiculous once you have tons of HR data to wrangle. BambooHR, Workday, and SAP SuccessFactors come with dashboards already built in if you're using those platforms. Google Data Studio's decent for tight budgets. Some people love Looker but honestly it might be overkill depending on your needs. I'd figure out what metrics you actually want first, then see what plays nicely with whatever systems you're already stuck with.
Honestly, HR dashboards are game-changers for tracking training stuff. You'll see everything in one spot - who finished mandatory courses, when certifications expire, who's ready to level up. The visual reports are clutch because patterns jump out at you immediately. Like, oh wow, the sales team is way behind on compliance again. Set up automated reminders so people don't forget deadlines (trust me, they will). I'd start with your most critical programs first - don't try to track everything right away or you'll overwhelm yourself. Then just build from there as you get comfortable with it.
Dude, HR metrics without benchmarking are basically useless numbers floating around. Compare your turnover and engagement scores to industry standards or your own past data - otherwise how do you know if 15% turnover is amazing or terrible? It's like driving without knowing speed limits, honestly. Plus it helps you figure out realistic goals instead of just guessing. I'd start with industry reports for your sector (they're usually free online) or just track your own quarterly trends. Actually kind of surprised how many companies skip this step.
Honestly, just focus on what actually matters for your industry. Healthcare places need compliance certifications and patient safety stuff tracked. Tech companies? They're obsessed with retention and skill development metrics. Manufacturing is all about safety incidents and shift planning - makes sense when you think about it. Don't just copy other dashboards you've seen online. Ask your leadership what stresses them out most, then build around those problems. That's literally the difference between a dashboard that gets used daily vs one that collects digital dust.
Honestly, HR dashboards are clutch for compliance tracking. Real-time data shows you training completions, cert renewals, audit documentation - all that fun stuff. During audit season? Total lifesaver. You can spot missing policy acknowledgments and track incident timelines before they become problems. The automated alerts are where it really shines though - flags upcoming deadlines for mandatory training so nothing gets forgotten. Oh, and it'll track diversity targets and wage equity too, which is huge these days. Set up those alerts first thing - trust me on this one.
-
Wonderful templates design to use in business meetings.
-
Excellent products for quick understanding.