Human Resource (HR) managers handle the most important resource businesses have in their kitty, their people or the staff. The range of senior HR personnel’s work is spread across departments, and the easy and most efficient way to manage the workload is using HR dashboards for data. An HR dashboard is needed as data today is generated, recorded, and analyzed for every activity at the workplace.
From designing the recruitment process, taking care of training needs, performance management, finance, and the exit interview of every single employee, the HR manager, ends up with a lot of numbers. Taking care of the company’s work culture, organization and employees’ health, employee engagement, etc., also falls on his/her to-do list. It is the professional duty of HR managers to stay updated, as the management could ask for a report at any moment.
HR Dashboard: A Visual Presentation and Business Intelligence Tool
An HR dashboard is a visual presentation and business intelligence (BI) tool that HR managers, supervisors, and administrators use to monitor, track and exhibit analytical data in an exhaustive manner. Its benefits are:
1. Access to crucial organization reports in one place.
2. Help gather data from multiple sources.
3. It allows data accessibility across devices and round the clock.
4. Create data once and share it with persons and teams multiple times.
5. Design an effortless visual presentation of complex analytical data.
6. HR metrics dashboard will help predict and understand trends in performance.
7. Based on trends and insights, HR/team leads/management can understand current and potential opportunities for improvement.
“Where do you see yourself in the future?” The answer to this question and a dream career is just a click away! Download these pre-designed career planning templates and grab the opportunity you have been waiting for.
HR DASHBOARD DRIVES SOLUTIONS
An HR dashboard also helps drive effective solutions for recruitment, employee engagement, productivity, employee retention, and other employee management tasks. An HR dashboard with the right Key Performance Indicators (KPI) will help the organization flourish and get on the growth track in these three main areas of the domain; these are workforce, compensation, and recruitment.
Applying for a dream job, or do you want to grab an opportunity in a career shift? Read this guide on resume summary, and with the help of our pre-designed resume templates, create a perfect resume.
There are no universal standards as yet for these dashboards. You can choose to add the following as metrices in dashboard per your organization’s requirements:
1. Vacancies: Keeping a check on staffing requirements of each department and level of organization will help you regularize recruitment campaigns.
2. The number of employees: This metric includes the headcount of each department with the total work experience of each person. You can compare departments on workforce strength.
Diversity in the workplace increases harmony and gives birth to unique and new ideas. Celebrate and spread the importance of diversity and inclusion with our readily available Cultural Diversity PowerPoint templates.
3. Compensation Management: It has employee salary and benefits (health, insurance, allowances), departmental expenditures, and level by division of payrolls. This metric can help improve financial management.
4. Incentives: Based on performance, how much incentive(s) can be distributed to each employee (department-wise); the budget is the key variable here.
5. Work hours: This metric keeps track of how employees are using company time. These are login, logout, productivity hours, breaks, absenteeism, etc.
6. Attrition: Number of people who left the organization. This metric will help draw a pattern of attrition — which department has the most resignations? At which level are employees resigning more? What are the possible factors?
7. Exit Interviews: HR managers can conduct exit interviews to understand resignation and feedback.
8. Training metrics: This metric delineate details of training programs (live and upcoming) like the number of participants, candidates passed, Training Need Analysis (TNA), etc.
9. Employee Performance: This includes Key Responsibility Areas (KRAs), attendance, work quality, and other employee performance indicators. Here, HR Dashboards help us gauge performance and productivity.
Customizable HR Dashboard Templates
Deciding on the right set of metrics and creating an HR dashboard from scratch is tedious and time-consuming. To save HR managers from this, we offer our custom-made HR dashboard templates. Explore these PowerPoint sets and choose the best fit for your workforce management requirements.
1. Human Resources KPI Dashboard PowerPoint Template
This human resources kpi dashboard presentation deck will help you manage and present data as a visual treat for the top management. This dashboard will help you record and display the rate of absence, hiring across departments, gender-wise pay, headcount, and the active vs. new hiring requirement. It is the perfect choice for an HR manager to conduct a performance review. Get the resource to turn your thoughts into organized, effective presentations. Download this template to make a difference.
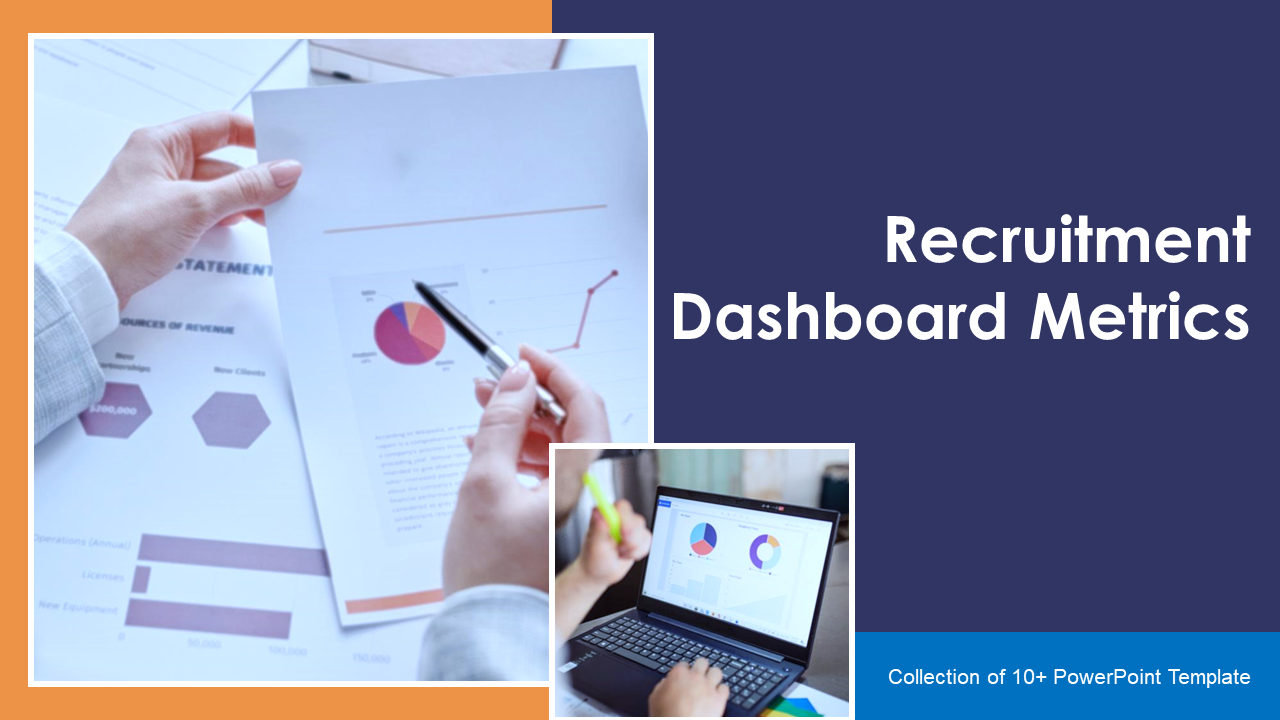
2. Recruitment Dashboard Metrics PowerPoint Presentation
This content-ready PowerPoint deck will be perfect for drafting a presentation to capture the organization’s work. It helps you present recruitment costs, application sources, hires per month, hiring source, salary range, and more. You will analyze and present the effectiveness of recruitment drives with this PPT graphic. Click the link below!
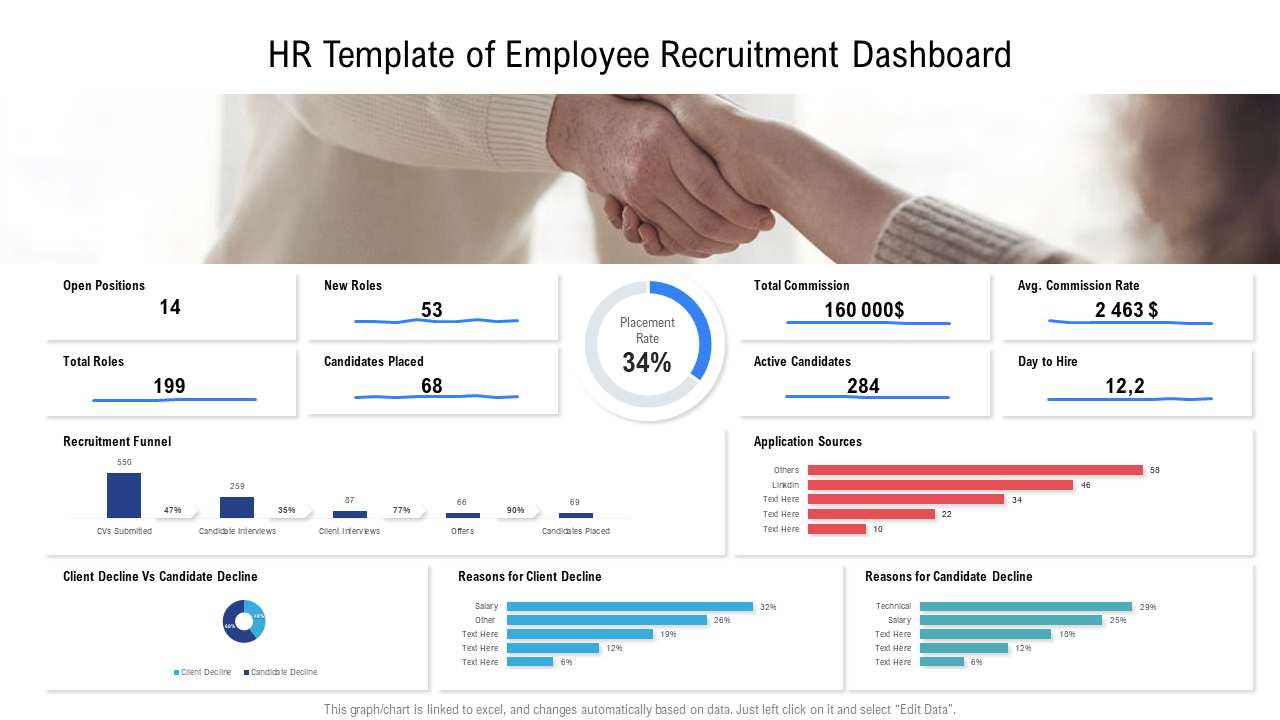
3. HR Dashboard For Employee Recruitment Presentation Template
This comprehensive PPT set will help the HR team monitor their recruitment process. It will show you analytical data of multiple factors affecting the hiring process, like positions open, application sources, the reason for candidate/client decline, etc. Grab this design and keep an eye on the recruitment funnel.
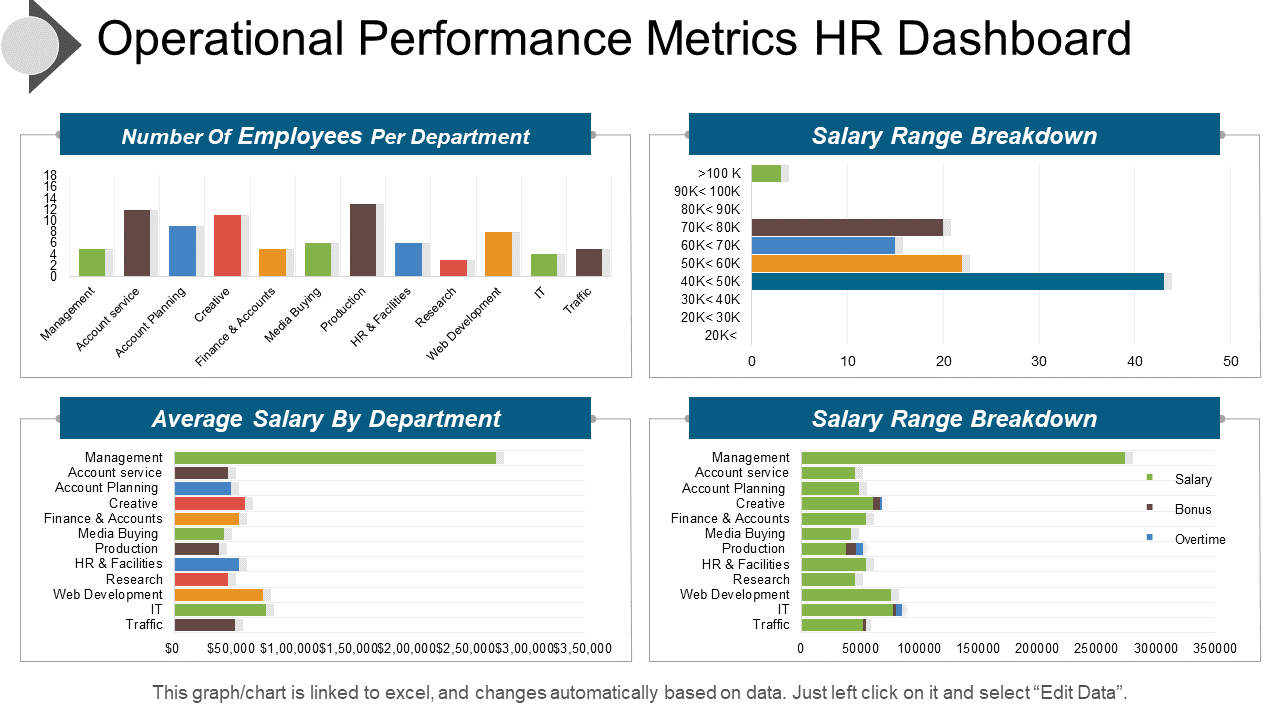
4. Operational Performance Metrics HR Dashboard Presentation Slide
This is a well-researched HR dashboard template based on the theme of operational performance metrics. This PowerPoint set will help measure the efficiency of the HR team based on KPIs like salary (negotiation), employees working in the department, the average length of service, average retirement age, and more. Simplicity is complex to master; this template offers the best way to achieve and execute it in your presentation on HR dashboards.
The four pillars of an organization — finance, learning & growth, business operations, and client — must be strong for future competitive success. Use this quick guide replete with templates on a balanced scorecard to take your business to new heights.
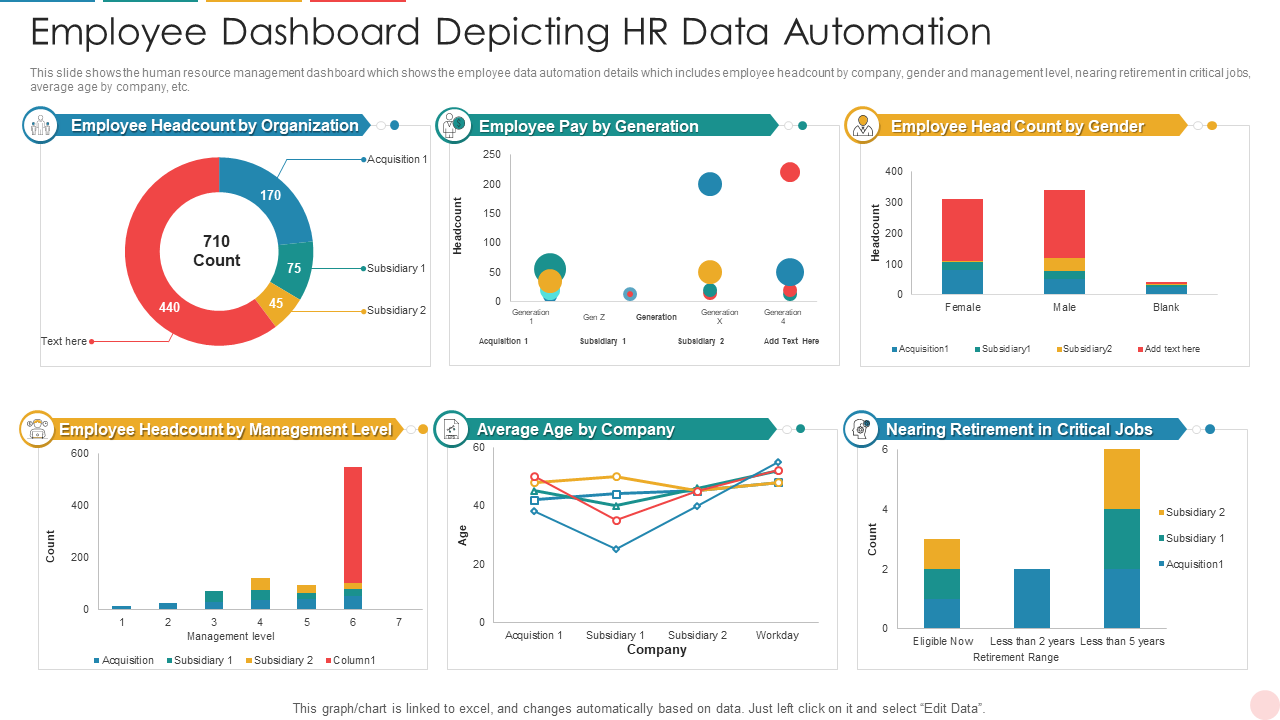
5. HR Data Automation Dashboard PowerPoint Template
This data-driven PPT layout will do a commendable job presenting HR metrics data to management. It is compatible with data harnessing tools like MS Excel and Tableau. This template is the toolkit you have been yearning to make an impact during an HR Dashboard presentation.
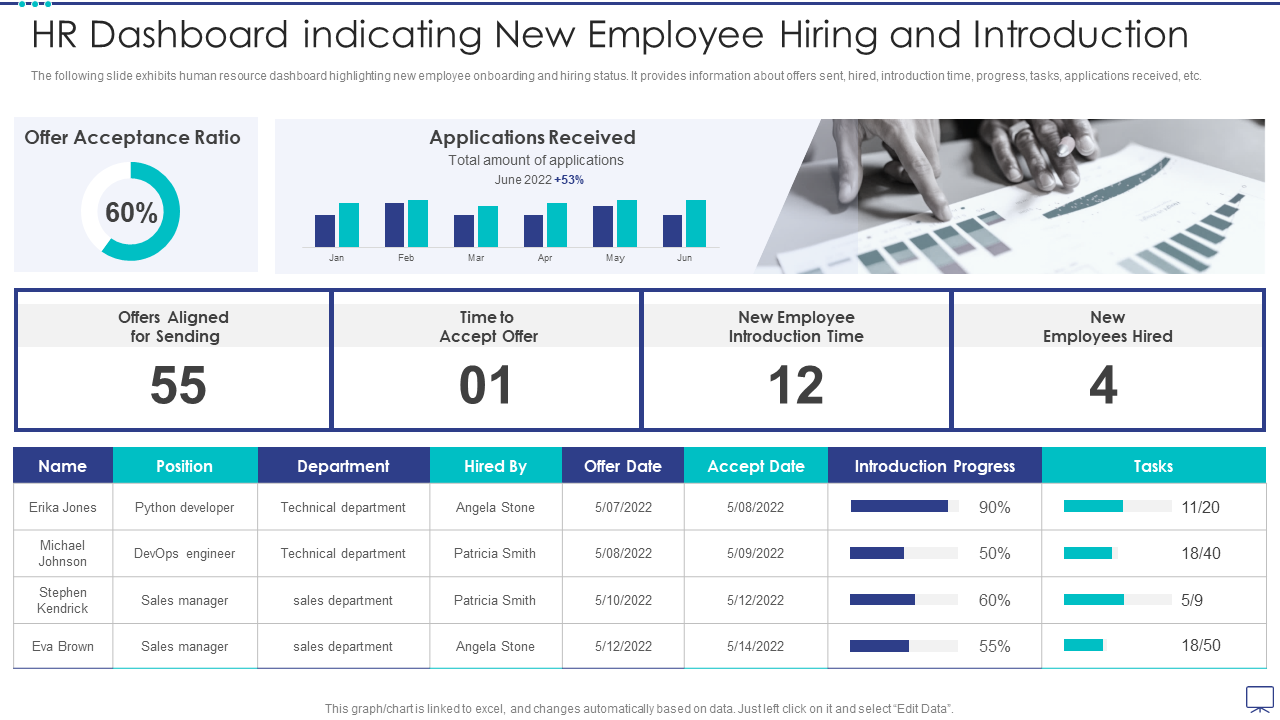
6. HR Dashboard PPT For New Employee Hiring And Introduction
This aesthetic PowerPoint preset will help in managing the process of hiring and orientation of new employees. It will help showcase data such as offer acceptance ratio, received CVs, the average time to accept an offer, and introduction time. Your presentation with this re-defining template on HR Dashboards will open doors to new opportunities. Capitalize now!
Introduce the new hires to organizational structure in an easy-to-understand manner with the help of these eye-appealing org chart templates and help them to gel up and become comfortable in the new work environment.
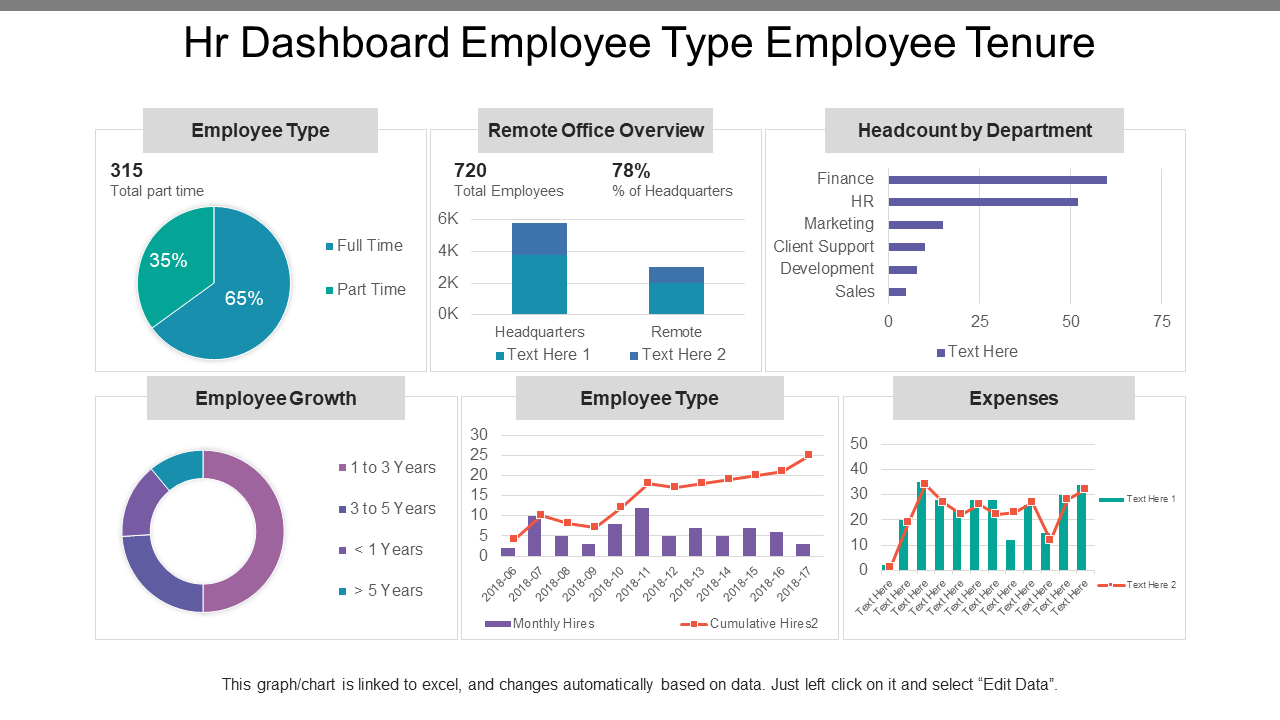
7. HR Dashboard Employee Type and Tenure PowerPoint Slide
Help your team monitor the employee type and their years of service with the help of this HR employee dashboard template. It will help you present employee-related information like growth, expenses, type, remote office overview, headcount per department, and more. Don’t miss this opportunity to design an impactful presentation.
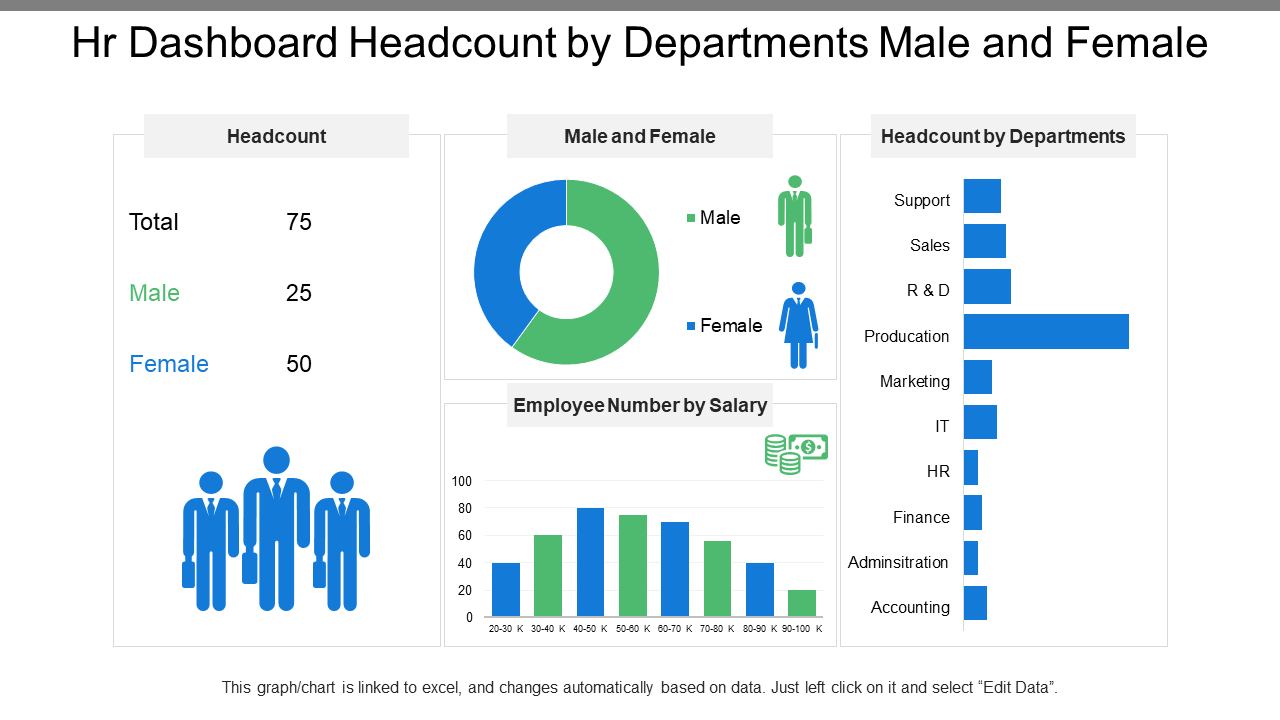
8. HR Dashboard PPT Template with Department-Wise Headcount
Draw a comparison between two departments based on workforce strength with this PowerPoint slide. It will help you organize data related to gender ratio, employee number by salary, headcount in every department, and more. This graphic will add value to your presentation with its pie charts and bar graphs. Grab this PPT design now!
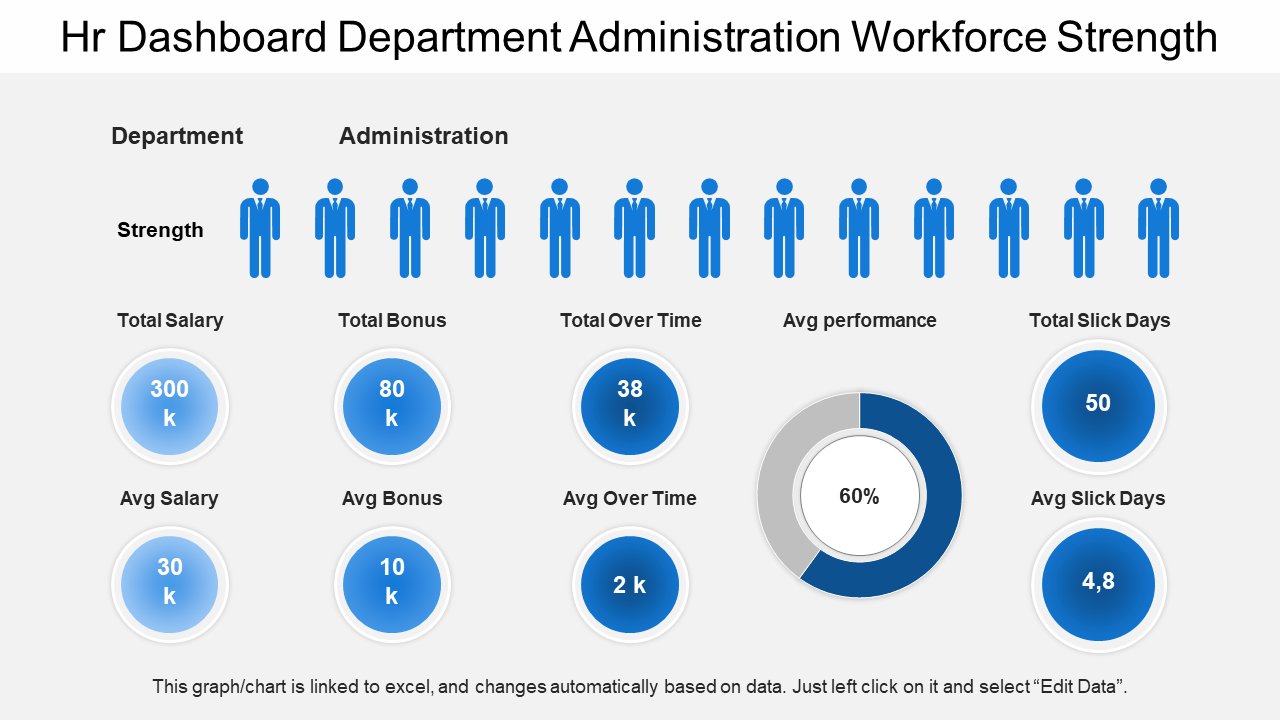
9. HR Dashboard Department And Workforce Administration Slide
This progressive PPT deck offers data-driven insights into the number of employees in a department(s). This presentation slide will help you build a foundation for implementing best practices for managing employees’ monetary benefits. It is structured with a detail-oriented approach to ensure you miss out on nothing on employee benefits while delivering your presentation. Click the link below!
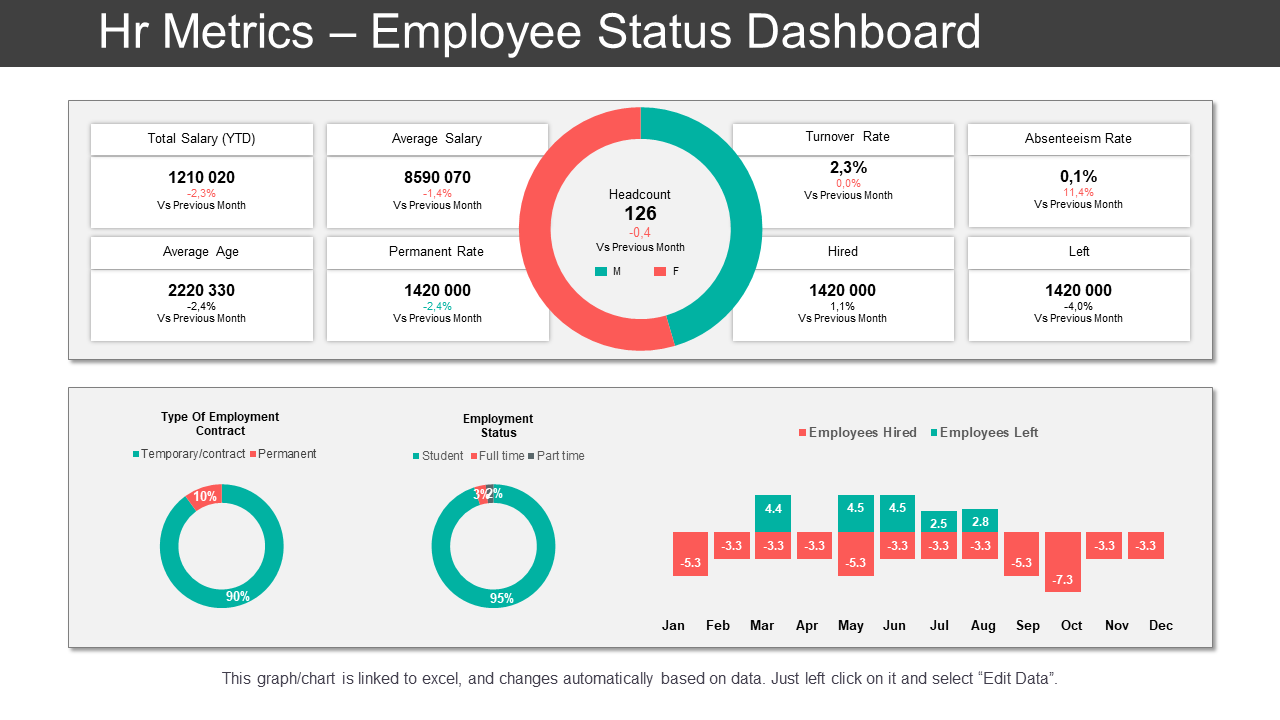
10. HR Metrics Employee Status Dashboard Presentation Template
This creative PowerPoint set of HR Dashboards is designed to help management analyze recruitment strategy. It will provide information on total and average salaries, age, turnover rate, absenteeism rate, etc. Click below to download this presentation!
The Final Word
HR dashboards are an influential tool for every kind of business. The highlight of this instrument is its ability to change the landscape of how you deal with HR issues in your business. Our dashboards just make everything easier. The solution is just a click away.
Don’t miss the opportunity to get your hands on these evocative HR dashboard templates. Grab these designs and start managing your workforce in an intelligent and efficient manner.
P.S. Whether looking for a single prime candidate or hiring in bulk for your organization, this guide and templates on hiring and recruitment will help you achieving the target in effortless manner!
FAQs on HR Dashboard
1. What is an HR Dashboard?
An HR dashboard is a scientific way to process information for the human resources professional. It makes the stated mission of HR, which is to make people aware of and fulfill their potential, a lot easier to execute. In a good HR dashboard, with relevant data available (which can be different across different industries), the human potential is turned from being totally intangible to one on which decision-making becomes easy. An HR dashboard is a visual presentation and business intelligence (BI) tool that HR managers, supervisors, and administrators use to monitor, track and exhibit analytical data in an exhaustive manner.
2. What are the good KPIs for an HR dashboard?
There are several KPIs that matter when dealing with HR and its representation on an HR dashboard. The rate of absenteeism, productivity increase, time clocked in, and healthy interpersonal competition at the workplace are all KPIs that a dashboard can and does track. The turnover rate is closely tied to talent retention. Rather than calculating the number of employees who left, this KPI counts the number of employees that stayed or were retained.
3. What are the standards followed in an HR dashboard?
There are no universal standards as yet for these dashboards. According to the specific needs and requirements, we can add vacancies, the number of hours worked, the extent of diversity in the organization, and so on. Given incentives, work hours, responses to engagement activities, etc., can all be tracked and monitored. Metrics like compensation and training can also be tracked.
4. What are the common use cases of HR Dashboards?
The most common use of the HR dashboard is that it indicates in empirical terms where the organization is placed in terms of the best practices in the industry or the specific business it is in. It also helps HR managers answer key questions when deciding on people who can be really productive and deserve to be taken care of in a special manner. Over time, even indicators like where organizations are placed on their diversity efforts could also be part of the HR Dashboards.




 Customer Reviews




![[Updated 2023] 20 Must-Have Recruitment Strategy Templates For Every Human Resource Department!!](https://www.slideteam.net/wp/wp-content/uploads/2020/09/size1001-436-29-335x146.jpg)
![Top 15 Operational Dashboard Templates to Capture Your Organizational Performance [Free PDF Attached]](https://www.slideteam.net/wp/wp-content/uploads/2022/04/banner-4-1013x441.png)
![Top 15 Project Status Dashboard Templates to Pave the Way to Organizational Efficiency [Free PDF Attached]](https://www.slideteam.net/wp/wp-content/uploads/2022/03/Top-10-Project-Status-Dashboard-Templates_1-1013x441.png)
![[Updated 2023] Top 10 Corporate Mentoring Templates to Nurture the Human Capital of Your Company](https://www.slideteam.net/wp/wp-content/uploads/2021/04/Top-10-Corporate-Mentoring-Templates-to-Nurture-the-Human-Capital-of-Your-Company-493x215.jpg)
