Business intelligence (BI) refers to the tools, technologies, and processes used to collect, integrate, analyze, and present business and external sources’ data and information. BI aims to provide organizations with the insights and knowledge required to make calculative decisions at three levels of business — strategic, tactical, and operational.
History of Business Intelligence
The concept of business intelligence has a history dating back to the early 20th century. It is a concept that evolved gradually over time. Earlier BI systems had ‘reporting’ as their primary function to help managers access the summary of past performance. In the 1950s and 1960s, BI systems began incorporating more advanced capabilities, such as analyzing data and making forecasts.
During the 1980s and 1990s, advanced analytical and visualization tools, such as pivot tables and charting software, became part of BI systems. These tools made it easier for users to analyze and interpret large amounts of data and create reports and dashboards.
In the 21st century, BI has continued to evolve with data management and analytics to become today’s sophisticated business tool. They have advanced capabilities such as predictive analytics, machine learning, and natural language processing. Tony Starks’ Jarvis, Wednesday, and EDITH are perfect fictional artificial intelligence (AI) examples of modern BI.
Business Intelligence and Dashboards
Dashboards are a key component of business intelligence (BI) systems that present data and information in a visually appealing and interactive format. They provide a real-time, high-level view of key performance indicators (KPIs) and other metrics customized to meet the specific needs of the user/audience. Major reasons to use dashboards for BI efforts are:
- Data visualization: Dashboards allow users to view and interpret data with visual aids like charts, graphs, and maps. This presentation of data makes understanding and analyzing big data easy to identify trends and patterns.
- Real-time monitoring: The latest updates on key metrics enable managers to stay informed about their position. KPI dashboards are helpful in real-time tracking of an organization/business performance.
- Customization: With pivots and filters, dashboards are easily customizable to reflect only the desired and user-relevant data/metrics, making it easier to focus on what is important.
- Collaboration: Dashboards allow users to share and collaborate on data & analysis with their colleagues or other members.
- Alerts and notifications: Another useful ability of dashboards is to set up alerts and notifications to update users when specific conditions or thresholds are met/ not met.
Pre-designed Business Dashboard Templates
Our plug-and-play business intelligence dashboard templates are easy-to-customize for the specific needs of your enterprise. These are your ideal option if you are looking for a tool to create professional-quality dashboards to support your BI efforts. Use these plug-and-play templates to save time and resources. They give you a nice head start as you don’t need to design the dashboard from scratch or hire a designer.
Let’s explore these business intelligence dashboard designs to prepare an aesthetic and cost-effective BI data presentation tool!
Bonus Template: Business Intelligence PowerPoint Presentation Deck
This presentation deck will help you understand and present the business intelligence (BI) concepts to the audience. It contains BI details such as processes and its systems in 39 high-quality descriptive slides like introduction, objectives, components, Key statistics, reasons for its use, survey statistics on its adoption, investment by various industries, sector-wise role, etc. Get it now!
1. Business Intelligence KPI Dashboard PPT Template
Data rules the world. The one who knows how to use data to gain a competitive edge rules the business world. And for that, you need an actionable PPT template that allows you to read and comprehend critical business data with ease. It includes KPIs like customer base, NPS score, Net income, customer distribution, inbound leads, and business hotspots. Grab it today!
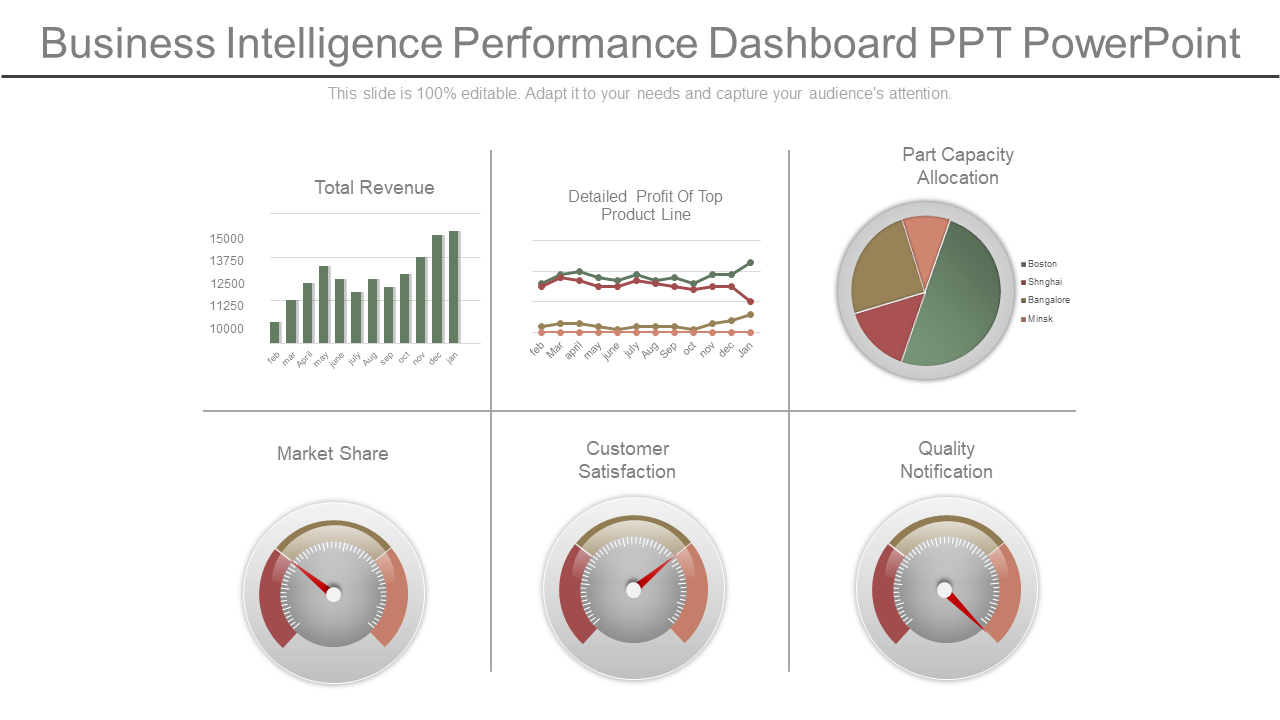
2. Business Intelligence Performance Dashboard PowerPoint Slide
BI tools provide a broad view of your business as they consolidate data of all aspects into one place. Handling such a large chunk of data in one place might seem overwhelming sometimes. Therefore, business managers put it in dashboards like the one below and access/analyze the relevant data. This BI dashboard template contains information on business performance with metrics like total revenue, detailed profit, capacity allocation, market share, customer satisfaction, and quality. Download it now!
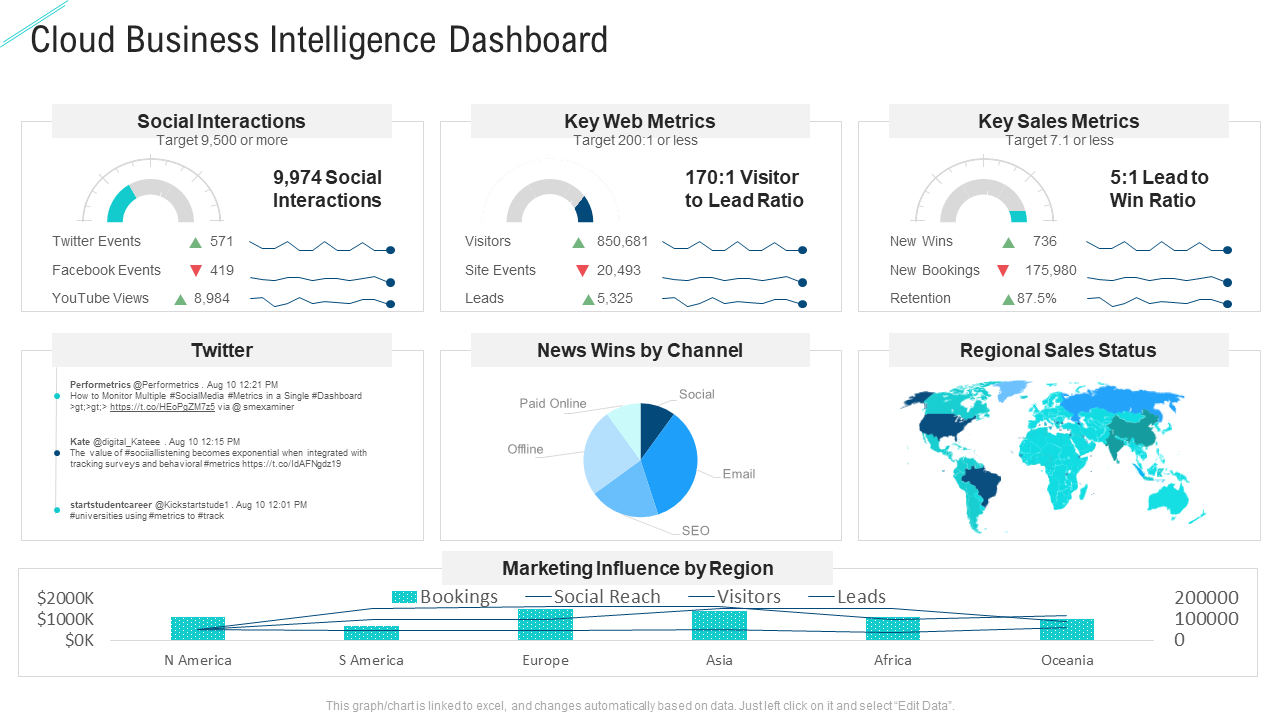
3. Cloud Business Intelligence Dashboard Presentation Template
One part of business intelligence is data management, and a further breakdown of it is smart data storage. When it comes to holding big data, nothing is better than cloud servers. This template will create a business intelligence dashboard to help you maintain cloud storage. It entails statistics and data for social interactions, key web metrics, key sales metrics, regional sales, and marketing influence. Get it now!
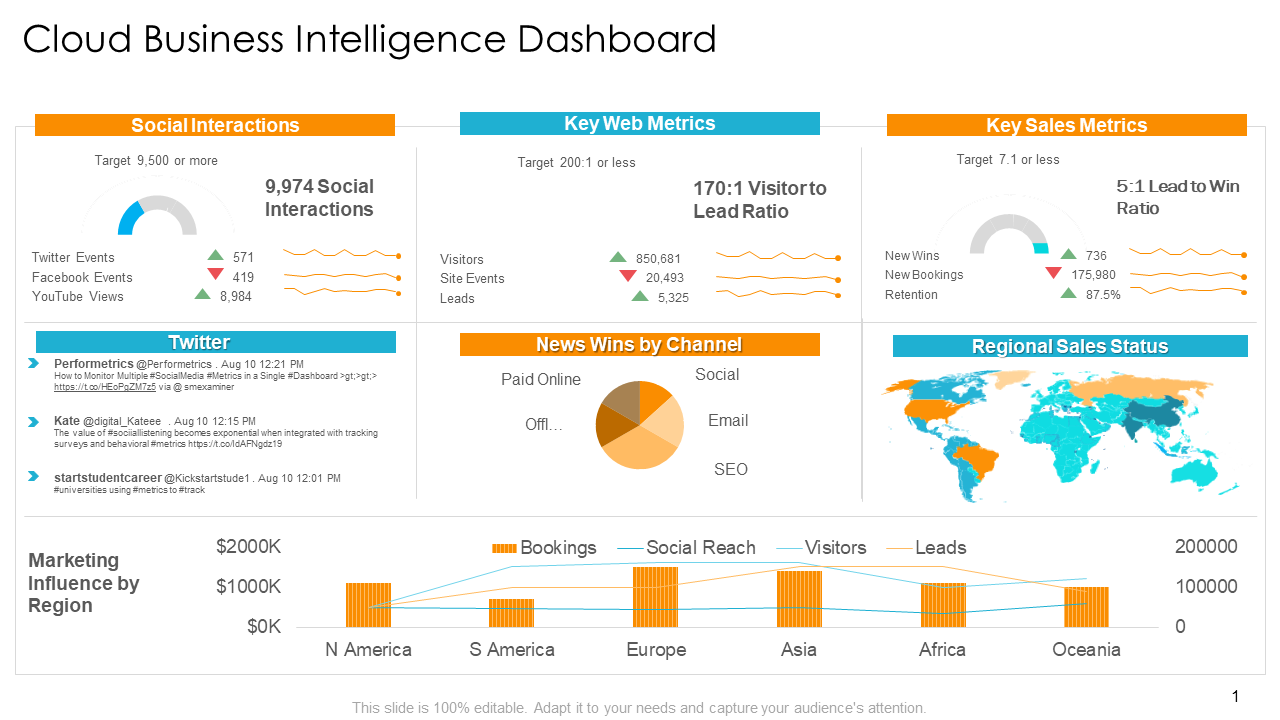
4. Cloud Business Intelligence Dashboard PPT Presentation Template
Indeed, clouds are the tools of the modern world. However, the businesses/websites running on the cloud servers struggle to manage and track data, especially if service providers do not offer an analytics dashboard. Let your worries go away with this ready-to-use template, and set up a new and useful dashboard in minutes. It has pre-designed spaces to include data from web metrics, sales metrics, social media channels, regional markets & sales statistics, and related insights. Get it now!
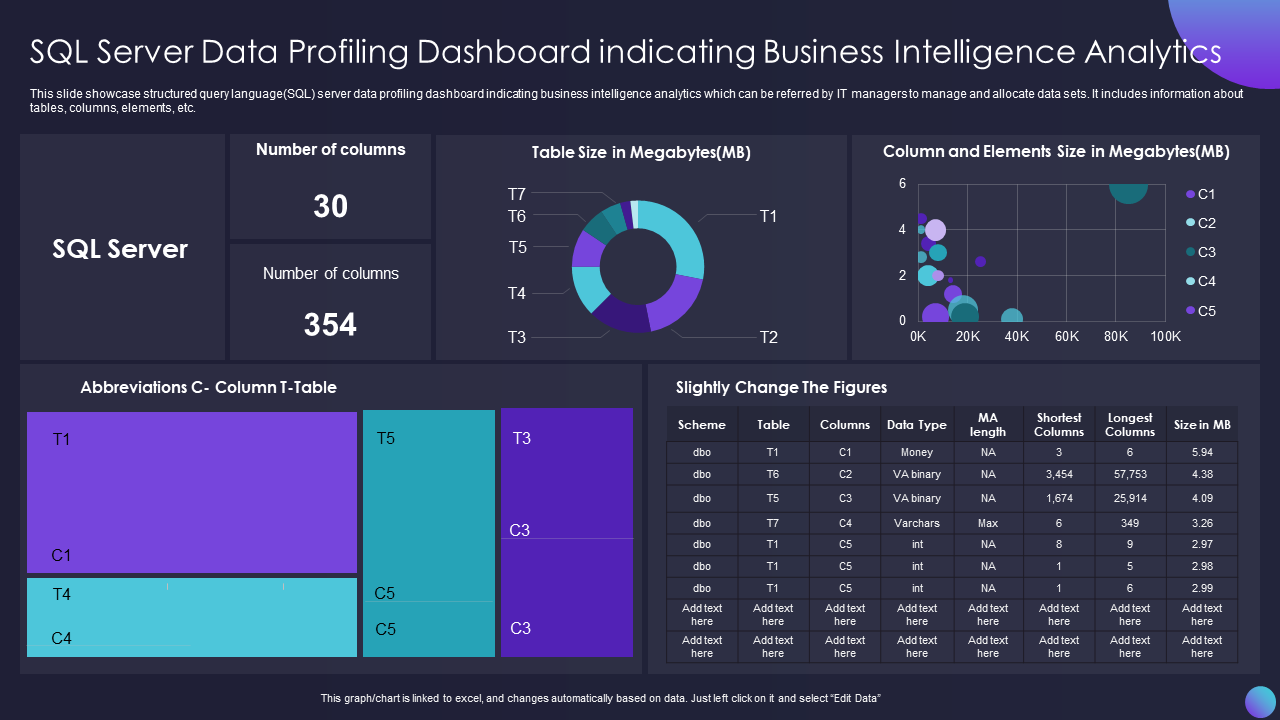
5. Business Intelligence Dashboard Template for SQL Data Profiling
SQL Server data profiling allows you to analyze the stored data in a database table and identify potential issues with the information. It also helps you to understand the quality and structure of the data. This BI dashboard template will complete and regularize technical data management tasks with KPIs like the number of columns, table size (in MBs), and multiple figure changes. Grab it now!
Presenting statistics in a simple and easy-to-understand manner is a rare art in the business world. Master 25 different ways to present statistics with the help of this guide, and also get access to stunning presentation designs to practice them!
6. Business Intelligence KPI Dashboard PowerPoint Template
BI tools like dashboards collect and structure scattered and multi-format business data in one arrangement, making the analysis easy for users. This dashboard template will collect valuable data on the company’s finance, business growth, customer base, sales, revenue, etc., and present it in an easy-to-read manner. Download it today!
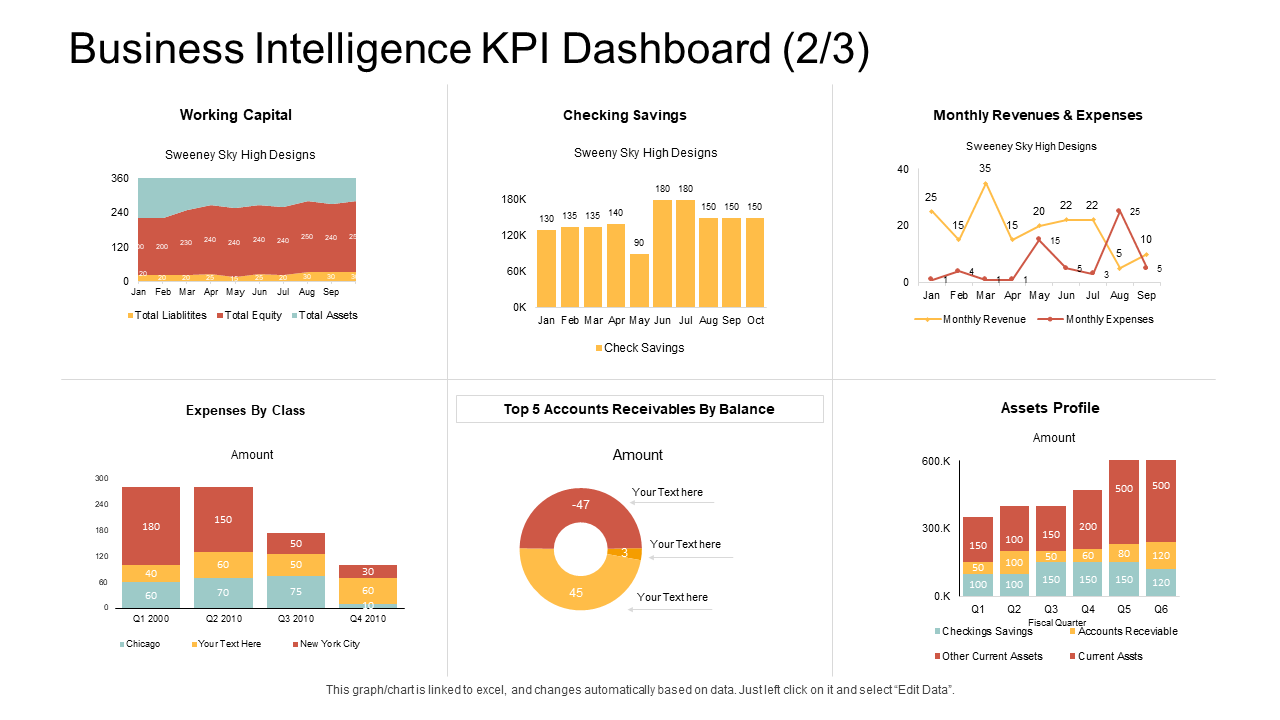
7. Business Intelligence KPI Dashboard Presentation Template
Insights provided by BI dashboards are critical to management, especially in making informed decisions. They should be created and analyzed carefully to save heavy disastrous losses. Our business intelligence dashboard templates provide pre-designed layouts to create these visualization tools with no room for error. This PPT Slide includes BI dashboard KPIs like working capital, monthly revenue & expenses, top five accounts data, asset profile, and more. Download it now!
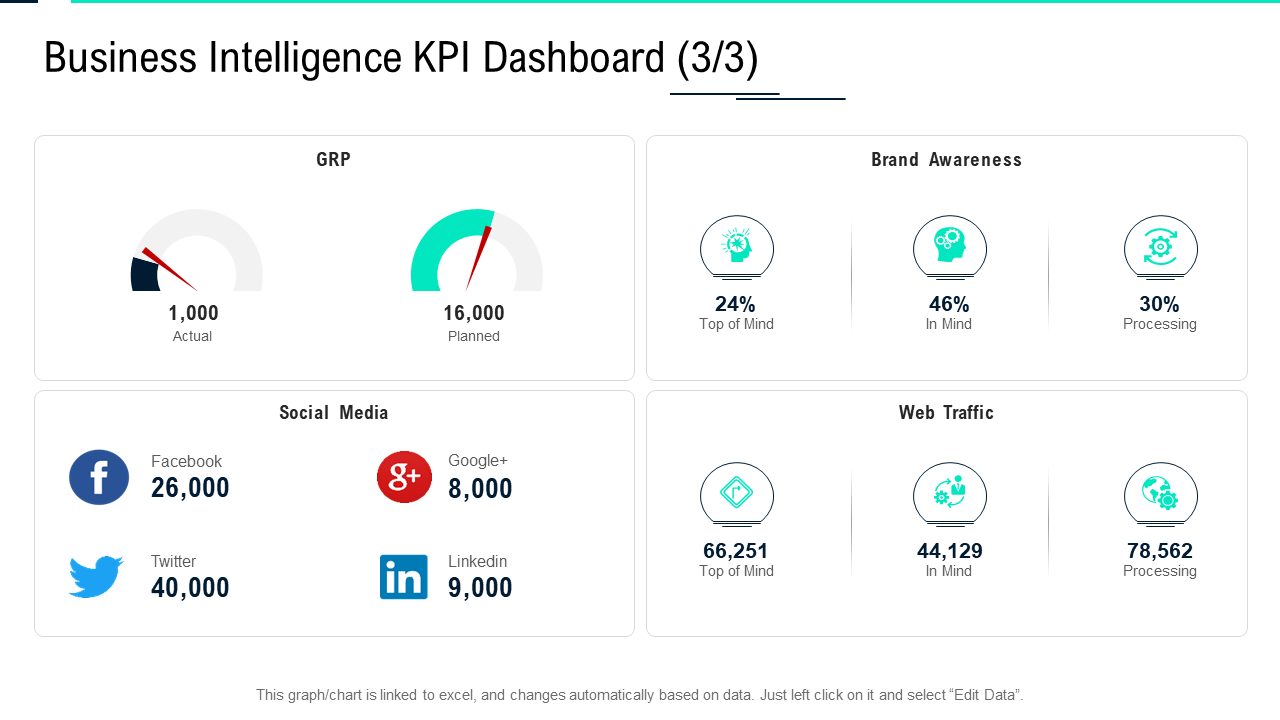
8. Business Intelligence Dashboard Template with Social Media Integration KPIs
Social media holds tremendous significance and profit to modern digital businesses but combined with business intelligence, it can do wonders. This template will provide you with a chance to take one step further with your social media efforts. It gives you a BI dashboard that reflects your social media channels/campaign data, GRP, brand awareness, web traffic, and followers from each platform. Grab it today!
9. Business Intelligence Dashboard Template for Infrastructure Activities Tracking
IT and development industries were the first to use intelligence tools for business purposes. At first, it was used for data management, risk control, and incident management. Nowadays, a BI is deployed for tracking infrastructure purposes too. This dashboard template will help you track the what, where, when, and how of IT operations. It entails KPIs like transaction duration history, notable event history, and server room power usage. Grab it now!
10. Business Intelligence Dashboard Template for Process Analytics Data
Monitoring and optimization of business processes is one way for organizations to cut corners and drive little secret profits. A business intelligence dashboard reflecting process analytics like average activity duration, completed & active activities, total duration, active task & participants, total participants & outcomes, etc., will help you in this. Grab it now!
At the End
BI dashboard helps organizations to transform data into actionable insights that are used to improve business performance, boost efficiency, and make informed decisions. It is an essential tool for any organization looking to optimize performance and drive growth.
Our business intelligence dashboard templates will be an ideal option for you to develop this tool without wasting much of your time and resources. These PPT Layouts are expert-designed to provide you with high-quality data that is valuable for your business.
Get hold of these dashboard designs by visiting the above links and start changing the business landscape with one of the most advanced strategy — Business Intelligence, aka BI.
FAQs on Business Intelligence Dashboards
1. What are the key elements of Business Intelligence?
Key elements of business intelligence that are used to collect, integrate, analyze, and present data and information:
- Data sources: BI systems incorporate data from various sources, including transactional systems, databases, spreadsheets, and external sources such as market research firms and social media platforms.
- Data integration: BI systems integrate data from multiple sources, stored in different formats and structures. Data integration tools extract, transform, and load (ETL) the data into a central repository for analysis.
- Data storage: They use a centralized data repository, like a data warehouse, to store the integrated data. It allows users to access and analyze data from a single source of truth.
- Data analysis: They have a range of tools and techniques for analyzing data, including pivot tables, charting software, and advanced analytics such as predictive modeling and machine learning (ML).
- Data visualization: BI systems include tools for creating interactive dashboards and visualizations that allow users to easily understand and interpret data.
- Reporting: They help users to generate reports and document findings. Users can customize these reports to meet their or audience-specific needs in a variety of formats like PDF, Excel, and PowerPoint.
- Collaboration: BI systems contain tools/features that allow users to share and collaborate on data and analysis with their colleagues.
2. What are the different types of Business Intelligence?
Some common types of BI include
- Descriptive BI: Analysis of past performance and is focused on understanding what has happened in the past. It is often used to generate reports and dashboards that summarize key performance indicators (KPIs) and other metrics.
- Diagnostic BI: Involves the analysis of data to identify the root cause of a problem or issue. It is used to identify trends and patterns in data that help organizations improve processes and performance.
- Predictive BI: Statistical models and machine learning algorithms to forecast future outcomes or trends. It is often used to identify opportunities or risks.
- Prescriptive BI: Use of advanced analytics and optimization algorithms to recommend specific actions or decisions based on data analysis. Identify the most optimal course of action based on a set of constraints and goals.
- Strategic BI: Focused on long-term planning and decision-making and is used to support the development and execution of an organization’s strategic plan. It is a combination of descriptive, diagnostic, predictive, and prescriptive BI approaches.
- Operational BI: Focused on the day-to-day management of an organization and is used to support real-time decision-making and improve operational efficiency. It includes real-time dashboards and alerts to help managers stay informed about KPIs.
3. What is the role of business intelligence?
The role of business intelligence is to provide organizations with the insights and information they need to make better business decisions. BI helps organizations transform data into actionable insights to improve business performance, increase efficiency, and make informed decisions.




 Customer Reviews










![What is a Project Management Dashboard and Why Do You Need One? [With Best Templates] [Free PDF Attached]](https://www.slideteam.net/wp/wp-content/uploads/2022/03/1013x441no-button-19-1013x441.jpg)
