


Breakeven point chart





Try Before you Buy Download Free Sample Product
 Impress Your
 Audience
 100%
100% Editable
 Save Hours
 of Time


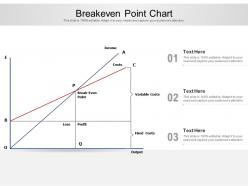
Introducing our Breakeven Point Chart PowerPoint Presentation Slide. Select this PPT template to introduce the business evaluating technique in an eye-catching manner. Choose our PPT slide for creating a successful plan of action for production management and management accountants. Employ this PPT template to compare the total variable and fixed costs with sales revenue. Take advantage of this PPT layout to measure the status of sales volume and production effectively and efficiently. With this content-ready PPT visual, you can graphically represent your logistics and statistics in an organized and well-structured manner. Display the costs at various levels of activity with the assistance of this PPT design. This PPT graphic is well-curated to display the logistics and statistics in the chart format. Diagram in this PPT presentation is professionally designed to illustrate the variable costs in an easily understandable way. Download this completely customizable PPT graphic and create a winning presentation.
People who downloaded this PowerPoint presentation also viewed the following :
Breakeven point chart with all 2 slides:
Use our Breakeven Point Chart to effectively help you save your valuable time. They are readymade to fit into any presentation structure.
FAQs for
So you need three things: fixed costs (rent, salaries - stuff that stays the same), variable costs per unit (materials, shipping, whatever changes with each product), and your selling price. Pretty straightforward so far. Take your fixed costs and divide by contribution margin - that's just selling price minus variable cost per unit. Boom, that's your breakeven in units. Honestly, once you get these basics down, you can mess around with different pricing scenarios and see what happens. The math isn't too scary, promise.
Variable costs mess with your breakeven point big time. Higher variable costs = you'll need way more sales to break even. Lower costs = you get there quicker. It's basic math really. Breakeven is fixed costs divided by contribution margin per unit (price minus variable cost). When variable costs go up, your margin shrinks per sale. Each unit does less heavy lifting toward covering fixed costs. I always tell people to hunt down ways to cut variable costs first - honestly, it's low-hanging fruit. Even shaving off a few cents per unit can drop the sales volume you need dramatically. Makes the path to profit way less steep.
Oh totally! It works great for service businesses. You just track different stuff - like billable hours or number of clients instead of physical products. Fixed costs are still your usual suspects: rent, salaries, that expensive software you probably don't use half the features of. Variable costs get trickier since they're things like contractor payments or materials per project. The math can get weird because services are so custom, but honestly the concept's the same. Just list your monthly fixed expenses first, then figure out what you typically make and spend per client. Way more doable than it sounds.
Honestly, breakeven analysis is pretty limited - it just tells you when you'll stop losing money. The problem is it treats everything like it's set in stone, which we both know never happens. Your costs change, prices fluctuate, and timing matters way more than people think. It also can't tell you if you're picking the best option out of several choices. I'd use it as a quick gut check, but don't stop there. You'll want to look at actual cash flow timing and maybe run some "what if" scenarios too. Otherwise you're flying blind on the big stuff.
So breakeven analysis basically shows you the absolute minimum you need to charge to cover costs. Pretty useful for avoiding those "oh crap, we're losing money on every sale" moments. You can play around with different prices and see how they change your breakeven volume - like whether you'd need to sell 1,000 units vs 10,000 to actually make profit. The tricky part is figuring out if your market can even handle those volumes at your price point. I'd run a few scenarios - best case, worst case, and somewhere in the middle - just to see what happens if things don't go perfectly.
So basically, your fixed costs are what determine how many units you gotta sell to break even. Like if you're paying $10k monthly for rent, salaries, all that overhead stuff, and each unit gives you $50 profit - you need 200 sales just to cover your ass. The math is pretty simple when you think about it. Honestly, this is why lean startups are so obsessed with keeping costs low. Break even comes way faster that way. Just write down every fixed expense you have first - that'll show you exactly how many sales you really need to survive each month.
Look, first figure out your actual breakeven point - then use that as your baseline for forecasting instead of just making up hopeful numbers. I see way too many people skip this part honestly. Try running different scenarios like hitting breakeven in month 6 vs month 12, see what that does to your timeline. Play around with sensitivity stuff too - bump your costs up 10% or drop pricing and watch how it shifts everything. Gives you real targets to hit each month instead of crossing your fingers. Oh and definitely review this monthly, things change fast.
Basically, one tells you how many units to sell, the other tells you how much cash you need to bring in. Take 1,000 widgets at $50 each - you'd need to hit $50,000 in revenue to break even. You figure out the quantity first by dividing your fixed costs by contribution margin per unit, then just multiply by your price. Honestly, I use quantity more for planning production stuff, but revenue's better when you're setting sales goals or doing budgets. Both are helpful but for different reasons, you know?
So basically you figure out how many units you gotta sell before you actually start making money. Add up all your fixed costs, then factor in what each unit costs to make plus your selling price. The math is super straightforward but honestly kinda brutal when you see the real numbers! Once you know that breakeven point, you can decide if it's worth it or if you need to tweak your pricing. Maybe cut some costs or just scrap the whole thing. I always use it for setting sales goals too - way better than just guessing what's realistic.
Honestly, tech makes breakeven calculations so much easier. No more manual data entry mistakes - you just pull everything straight from your accounting software. Variable costs get tracked automatically, and those sensitivity analyses that used to take forever? Done in seconds now. The real game-changer is handling complex stuff like multiple products or when your costs keep shifting around. That would be absolutely brutal to do by hand. Best part though - change one assumption and boom, you instantly see how it affects your breakeven point. I'd start by hooking up whatever data sources you're already using.
Honestly, charts are a game-changer for breakeven stuff. You can actually *see* where your revenue line hits your cost line instead of squinting at endless spreadsheet rows. That intersection point? That's when you start making money. Super helpful when you're tweaking prices or volumes - you'll spot the impact right away. Plus stakeholders don't fall asleep like they do with number dumps (learned that the hard way). I always throw together a quick plot now. Trust me, patterns jump out that you'd totally miss otherwise.
Static breakeven works great when your costs stay pretty steady - coffee shops are perfect examples since rent and supply costs don't jump around much. But if you're dealing with stuff that changes constantly? Go dynamic. Seasonal retail, SaaS companies, anything where your numbers swing monthly - that's when you need the flexible approach. I learned this the hard way with a client who ignored their CAC fluctuations (ouch). Dynamic actually tracks how variables shift over time instead of pretending everything's frozen. Quick test: will your key numbers change much during your analysis period? That's your answer right there.
Quarterly at minimum, but monthly's way better if your costs or prices shift around a lot. New products? Price changes? Big jumps in rent or payroll? That's when you definitely need to recalculate. I know some crazy competitive businesses that do it weekly during peak season - sounds nuts but keeps them nimble. Don't treat it like homework you do once and forget about. Monthly reviews are a solid starting point, then adjust based on how much your numbers bounce around. Oh, and actually put it on your calendar or you'll never remember to do it.
Breakeven analysis is basically your safety net calculation - shows how much sales can tank before you're in the red. I always run pessimistic numbers through it first because, let's be honest, initial projections are usually way too optimistic. You'll see exactly which costs are fixed versus variable, which is huge for understanding where you're most screwed if things go south. It's perfect for stress-testing different scenarios too. Like, what happens if costs jump 20% or sales drop by half? The whole thing keeps you realistic about what sales targets you actually need to hit before diving in.
Look, the big trap is treating breakeven analysis like it's some magic formula that'll predict your exact path to profits. It's not. Your costs won't stay neat and tidy as you grow - rent spikes when you need bigger space, suppliers give bulk discounts, stuff changes. Plus it assumes today's market conditions will stick around, which honestly? Pretty optimistic. Competitors show up, seasons shift, the economy does weird things. I'd use it as a rough guide to get started, but don't bet everything on those numbers staying accurate.
No Reviews