


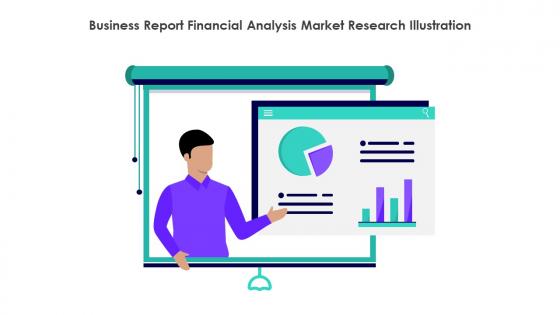
Business Report Financial Analysis Market Research Illustration




Try Before you Buy Download Free Sample Product
 Impress Your
 Audience
 100%
100% Editable
 Save Hours
 of Time


Use this Business report financial analysis market research illustration and create amazing PowerPoint presentations or graphics with ease. This downloaded file is available in all the editable formats such as EPS, PNG and Powerpoint pptx.
People who downloaded this PowerPoint presentation also viewed the following :
Business Report Financial Analysis Market Research Illustration with all 6 slides:
Use our Business Report Financial Analysis Market Research Illustration to effectively help you save your valuable time. They are readymade to fit into any presentation structure.





FAQs for Business Report Financial Analysis
Honestly, being a good BA is like half detective work, half people person. Data analysis and process mapping are obviously important - you've gotta break down messy problems and spot patterns. But the people side? That's where most folks struggle. Communication is huge because you're constantly translating tech speak for business people (and vice versa). Active listening matters more than you'd think - people rarely tell you what they actually need upfront. Oh, and you'll be running a ton of meetings, so facilitation skills are clutch. I'd focus on whatever feels shakier right now.
So honestly, it depends on who you're dealing with. Executives prefer one-on-one interviews - they hate wasting time in big meetings. Workshops are clutch for getting teams on the same page though. Surveys work when you need feedback from like 50+ people. Write everything in normal English, not business analyst speak (people's eyes glaze over with that stuff). Always read requirements back to them - catches so many misunderstandings early. Oh, and follow up within 48 hours while it's still fresh. I learned that one the hard way. Prep your questions beforehand and take decent notes.
Look, data analysis is what separates smart business moves from expensive mistakes. Raw numbers show you patterns and trends that gut feelings just can't catch. I've watched way too many people make decisions based on hunches and completely bomb. The trick? Pick one specific problem you're dealing with right now. Let the data actually answer your question instead of hunting for numbers that back up what you already think. It's wild how often the data tells a totally different story than what you expect. Start there and build from it.
Honestly, MoSCoW is your best bet if you need something quick - just bucket everything into Must have, Should have, Could have, or Won't have. Pretty straightforward. Weighted scoring's solid when you're juggling multiple factors like cost vs business value. The Kano model's amazing for understanding what'll actually make customers happy, but it's kind of a pain to set up initially. Value vs effort matrices are clutch because stakeholders can instantly see the trade-offs visually. I usually end up mixing two or three methods depending on how complex things get - probably overkill sometimes but whatever works, right?
So basically you get this visual roadmap of how work actually moves through your company. Makes spotting problems so much easier - like you can actually see where things get stuck or where people are doing redundant steps. Way better than trying to explain messy workflows in meetings, trust me. Your team will get it immediately when they see everything mapped out instead of reading through boring process docs. Honestly it's kind of like GPS for business stuff. I'd start with whatever process is driving everyone crazy right now.
Honestly, the worst part is dealing with stakeholders who swear they know exactly what they want but then change their mind every week. Conflicting priorities between departments will drive you nuts. Plus good luck getting executives to actually show up to meetings - they're always "swamped." Technical people and business folks might as well speak different languages half the time. Change resistance is real too, especially when you're messing with someone's favorite process. My biggest tip? Document literally everything and send follow-up emails after every single meeting. Trust me on that one. Also set expectations super early or you'll regret it later.
Honestly, don't just jump straight into the data - that's where most people mess up. Figure out what your company's actually trying to achieve first. Then make sure everything you find connects back to the metrics leadership obsesses over (revenue, costs, customer happiness, whatever). I've watched so many analysts get excited about cool patterns that literally nobody upstairs cares about. Before you present anything, ask yourself "okay, so what?" If you can't tie it to business impact, you're probably wasting everyone's time. Oh, and check in with stakeholders regularly so you don't go down some random rabbit hole.
Honestly, start with Tableau or Power BI for data viz - they'll save your life when you need to make sense of spreadsheet chaos. Power BI's probably your best bet if you're already in the Microsoft world. Lucidchart's solid for process mapping, way better than trying to draw boxes in PowerPoint like some people do. Jira keeps requirements organized without the headache. Excel's still weirdly essential for financial stuff, even though we all pretend we've moved beyond it. Oh, and learn some SQL - you'll thank me later when you're not constantly bugging IT for data pulls.
So basically, if your requirements are gonna change a lot and you need constant feedback, go Agile - like for new products or big digital overhauls. Waterfall's better when everything's locked down upfront, especially in heavily regulated stuff or system replacements. Most projects end up being a mix anyway, which honestly makes sense. Match your approach to how uncertain things are. Lots of unknowns? Do more iterative discovery. Pretty clear scope? Front-load your documentation. Just ask stakeholders straight up how much they think requirements will shift - saves everyone headaches later.
Honestly, visuals are a game changer for getting people to actually care about your analysis. Charts and graphs help stakeholders spot patterns way faster than endless spreadsheets - I swear, nothing kills engagement like a wall of numbers. People just process visual stuff better. You'll see executives light up when you show them a clean dashboard instead of drowning them in bullet points. Though I always start basic with bar charts first, then get fancier once I know they're comfortable with it. Visual storytelling beats dense reports every single time.
Honestly, you've gotta nail down a solid change control process right from the start - it's your best bet against scope creep. Get everything documented and make stakeholders actually sign off on the boundaries. New requests will pop up constantly (they seriously always do), but don't just cave to make everyone happy. Check each request against your original goals first. Look at timeline and budget impact, then give stakeholders options. Here's the thing though - make them pick what gets cut if they want something new added. Keep a change log for everything. Super helpful during retrospectives to spot patterns.
Honestly, you don't *need* to be a developer, but understanding the tech side makes everything so much easier. I learned this the hard way - you'll catch crazy timelines before they blow up, ask way better questions, and actually translate between business people and devs without looking lost. The main thing is grasping concepts like integrations and data flows well enough to have real conversations. Shadowing technical meetings helped me tons, even when half of it went over my head at first. Ask those "stupid" questions - developers actually respect that more than pretending you get it. Builds way more credibility than constantly saying "let me check with IT."
So here's the thing - when you're mapping out processes, you naturally start seeing where stuff could go wrong before it actually does. Data patterns are your friend for predicting issues. I always build risk assessment right into my regular BA work instead of treating it like some separate thing. Clear requirements documentation saves you from those awkward "um, that's not what we talked about" conversations later. Don't forget stakeholder analysis either - it shows you exactly who's gonna push back on changes. Honestly, contingency planning becomes way easier when you're already thinking about potential failure points during every evaluation.
Honestly, you've gotta nail down your success metrics right from the start - like during requirements gathering. Otherwise you'll be scrambling later trying to prove anything worked. I learned this the hard way on a project last year. Track the numbers stuff (KPIs, performance gains, adoption rates) but don't forget surveys and stakeholder feedback too. Set up a measurement plan before you even start building. Leading indicators like engagement are great, but you need the lagging ones like revenue impact to really show value. Do check-ins at 30, 60, 90 days so you can pivot if things aren't working.
Machine learning is totally changing business analysis right now. Pattern recognition that used to take forever? Now it's automated. Low-code platforms let you build stuff without bugging developers constantly. Cloud tools give you real-time data across the whole company - honestly it's a bit much sometimes keeping up. Everyone wants visual dashboards delivered like yesterday instead of those massive Word docs we used to do. You really should mess around with Power BI or Tableau if you haven't yet. Old school documentation isn't gonna fly much longer. The speed expectations are just wild now.
-
SlideTeam is my one-stop destination for templates. Highly recommended!
-
The visual appeal of the templates is just unparalleled! I was so worried about the design of my presentation but SlideTeam made it all so easy.