


81983018 style cluster stacked 6 piece powerpoint presentation diagram infographic slide




Try Before you Buy Download Free Sample Product
 Impress Your
 Audience
 100%
100% Editable
 Save Hours
 of Time


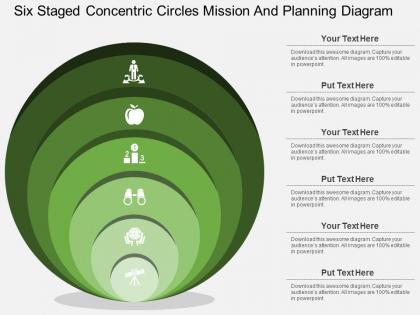
A blend of words and pictures is what you need to craft an emotional story that your audience will remember. What better way to do this than with professionally designed gt Six Staged Concentric Circles Mission And Planning Diagram Flat Powerpoint Design?
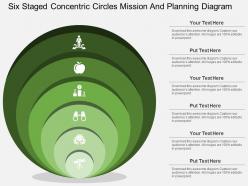
81983018 style cluster stacked 6 piece powerpoint presentation diagram infographic slide with all 4 slides:
Make your ascent exciting with our gt Six Staged Concentric Circles Mission And Planning Diagram Flat Powerpoint Design. The climb up the ladder will be a fulfilling one.
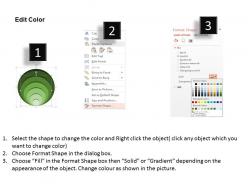
FAQs for 81983018 style cluster stacked 6 piece powerpoint presentation
The GT six staged concentric circles mission and planning diagram includes core mission at the center, followed by strategic objectives, tactical plans, resource allocation, implementation timelines, and performance metrics in expanding rings. This structured approach enables organizations to visualize strategic alignment from foundational purpose through execution, with many companies finding that the concentric model streamlines planning processes, enhances cross-departmental coordination, and ultimately delivers clearer accountability across all organizational levels.
The concentric circles model enhances strategic planning by creating layered priority frameworks, establishing clear stakeholder hierarchies, and enabling systematic resource allocation from core objectives outward. This visual approach helps project managers identify critical dependencies, align cross-functional teams, and maintain strategic focus, with many organizations finding that the structured progression from inner mission-critical elements to outer supporting activities ultimately streamlines decision-making and enhances project outcomes.
The GT six staged concentric circles model applies to project management through systematic phase planning, stakeholder alignment, resource allocation, risk assessment, timeline development, and outcome measurement. Organizations in construction, software development, and manufacturing use this structured approach to enhance project visibility, streamline decision-making processes, and ensure comprehensive planning, ultimately delivering improved project success rates and stakeholder satisfaction.
Organizations effectively implement the GT six staged concentric circles by establishing clear hierarchical alignment from core mission outward, defining specific objectives for each circle, and ensuring seamless integration between stages through regular assessment and feedback loops. Through systematic progression from innermost strategic priorities to outermost operational execution, companies in sectors like healthcare and manufacturing streamline planning processes, enhance resource allocation, and ultimately deliver measurable outcomes while maintaining strategic focus across all organizational levels.
Concentric circles planning offers enhanced flexibility, holistic perspective, interconnected thinking, and iterative refinement compared to traditional linear approaches. This methodology enables organizations to visualize relationships between core mission and expanding operational layers, adapt strategies dynamically, and maintain strategic alignment across departments, with many companies finding improved coordination and faster response times.
Stakeholders can be identified through comprehensive mapping across each concentric circle, analyzing internal teams, external partners, regulatory bodies, customers, and community groups relevant to each planning stage. The framework enables systematic stakeholder integration by positioning primary decision-makers in inner circles while engaging secondary stakeholders in outer layers, with many organizations finding that this structured approach streamlines communication, enhances buy-in, and ultimately delivers more comprehensive mission alignment across all organizational levels.
**INPUT**: What metrics should be used to evaluate the success of a mission using this diagram? **OUTPUT**: Success metrics for the six-staged concentric circles diagram should include stakeholder engagement rates, resource allocation efficiency, timeline adherence, and cross-functional collaboration scores across each circle. Organizations typically track completion rates per stage, budget variance, and strategic alignment indicators, with many enterprises finding that measuring both quantitative outcomes and qualitative stakeholder feedback delivers comprehensive mission evaluation. **Word count: 59 words**
Alignment across concentric circle stages creates synergistic momentum by ensuring each phase builds upon and reinforces previous achievements, eliminating resource conflicts and strategic gaps. This integrated approach enables organizations to maintain consistent messaging, optimize resource allocation, and accelerate goal attainment, with many companies finding that aligned planning reduces implementation time and enhances stakeholder buy-in.
Organizations face challenges including data complexity across multiple planning layers, resource allocation conflicts between concurrent stages, and coordination difficulties among cross-functional teams. While the model's comprehensive structure delivers strategic clarity, many companies find that implementation requires significant change management, robust communication systems, and executive alignment to prevent siloed thinking, ultimately demanding substantial organizational commitment to realize its full strategic potential.
The GT six staged diagram can be customized for specific industries by adapting the concentric circles to reflect sector-specific processes, regulatory requirements, stakeholder priorities, and strategic objectives unique to each business environment. Organizations in healthcare, manufacturing, financial services, and retail successfully modify the stages, terminology, and success metrics to align with industry standards, compliance frameworks, and operational workflows, ultimately delivering more targeted strategic planning and enhanced organizational alignment.
Feedback loops within concentric circles create dynamic pathways for continuous mission refinement by enabling data flow between strategic layers, operational teams, and stakeholder groups. These interconnected feedback mechanisms allow organizations to identify performance gaps, adapt to market changes, and realign resources across all planning stages, with many companies finding that systematic feedback integration accelerates strategic pivots and enhances organizational agility.
Visual representation transforms the GT model's complex planning stages into an intuitive, accessible framework that enables stakeholders to quickly grasp relationships between concentric phases, identify current positioning, and understand progression pathways. Through clear visual mapping, organizations can streamline strategic communication, enhance team alignment, and accelerate decision-making processes, with many finding that visual clarity ultimately delivers improved planning efficiency and stronger stakeholder engagement across all organizational levels.
Teams can collaborate effectively across different circles by establishing clear communication protocols, implementing regular cross-functional meetings, and utilizing shared project management platforms that provide real-time visibility into each stage's progress and dependencies. This structured approach enables seamless information flow between planning phases, with many organizations finding that dedicated liaison roles and standardized reporting frameworks ultimately deliver enhanced coordination, reduced redundancy, and accelerated decision-making throughout their strategic planning cycles.
**INPUT**: What tools or software are best suited for creating and illustrating the concentric circles diagram? **OUTPUT**: Professional diagram creation tools include Microsoft Visio, Lucidchart, Draw.io, PowerPoint, and specialized presentation platforms like SlideTeam. These applications streamline complex visual planning by offering customizable templates, collaborative editing capabilities, and professional formatting options, with many organizations finding that dedicated presentation tools deliver enhanced clarity, seamless integration with strategic documents, and ultimately more effective stakeholder communication than basic drawing software. *[Word count: 60 words]*
The GT six-staged concentric circles model enhances communication by creating a shared visual framework that aligns team members around mission priorities, strategic objectives, and implementation timelines from core to outer elements. This structured approach enables stakeholders to clearly understand dependencies, resource allocation, and progress milestones, while facilitating more focused discussions and reducing misalignment, ultimately delivering improved project coordination and stakeholder buy-in across complex planning initiatives.
-
Good research work and creative work done on every template.
-
Appreciate the research and its presentable format.