


Campaign Performance Dashboard For Brand Equity Measurement




Try Before you Buy Download Free Sample Product
 Impress Your
 Audience
 100%
100% Editable
 Save Hours
 of Time


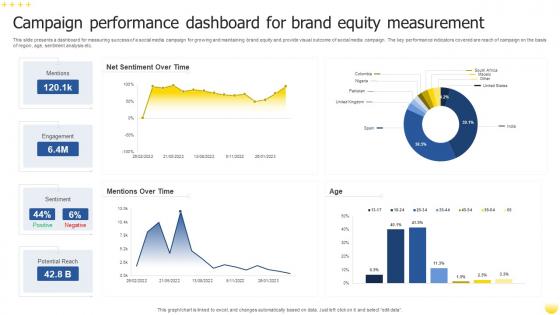
This slide presents a dashboard for measuring success of a social media campaign for growing and maintaining brand equity and provide visual outcome of social media campaign. The key performance indicators covered are reach of campaign on the basis of region, age, sentiment analysis etc.
People who downloaded this PowerPoint presentation also viewed the following :
Campaign Performance Dashboard For Brand Equity Measurement with all 7 slides:
Use our Campaign Performance Dashboard For Brand Equity Measurement to effectively help you save your valuable time. They are readymade to fit into any presentation structure.






FAQs for Campaign Performance Dashboard For
A Campaign Performance Dashboard should include conversion rates, click-through rates, cost per acquisition, return on ad spend, and engagement metrics across channels. These metrics enable marketing teams to optimize budget allocation, identify high-performing campaigns, and adjust strategies in real-time, ultimately delivering improved ROI and more targeted customer acquisition efforts.
Visualizations enhance campaign performance data interpretation by transforming complex metrics into intuitive charts, graphs, and heat maps that reveal trends, patterns, and anomalies at a glance. Through interactive dashboards, marketing teams can quickly identify top-performing channels, optimize budget allocation, and pivot strategies in real-time, ultimately delivering faster decision-making and improved ROI across campaigns.
**INPUT**: What tools are most effective for creating a Campaign Performance Dashboard? **OUTPUT**: Effective Campaign Performance Dashboard tools include Tableau, Power BI, Google Analytics Dashboard, HubSpot, and Salesforce Analytics Cloud. These platforms streamline campaign tracking by integrating multiple data sources, automating report generation, and delivering real-time insights, with many marketing teams finding that visual dashboards enhance decision-making speed and campaign optimization across digital channels. [Word count: 56 words]
Campaign data should be updated in real-time or near real-time intervals to ensure accurate decision-making, with most platforms offering hourly, daily, or continuous refresh options depending on campaign complexity and budget allocation. Marketing teams across retail, financial services, and e-commerce increasingly find that frequent updates enable faster optimization adjustments, improved ROI tracking, and enhanced competitive responsiveness.
Audience segmentation enables marketers to analyze campaign performance across distinct demographic, behavioral, and psychographic groups, revealing which messages resonate with specific customer segments. Through segmented analysis, organizations can identify high-performing audiences, optimize resource allocation, and tailor future campaigns accordingly, with many retail and financial services companies finding that targeted approaches deliver significantly higher conversion rates and ROI.
A/B testing results integrate into campaign performance dashboards through automated data feeds, real-time statistical analysis, and visual comparison widgets that display conversion rates, engagement metrics, and confidence intervals. These dashboards enable marketers to monitor test performance across email campaigns, ad variations, and landing pages simultaneously, while automatically flagging significant results, ultimately streamlining optimization decisions and accelerating campaign improvements.
Data collection challenges include inconsistent data formats across platforms, delayed reporting from third-party tools, incomplete attribution tracking, and integration complexities between systems. These obstacles can significantly impact dashboard accuracy and real-time insights, with many marketing teams finding that establishing standardized data protocols and automated collection processes ultimately streamlines reporting while enhancing campaign optimization capabilities.
A well-designed dashboard influences marketing strategy by providing real-time performance insights, identifying high-converting channels, revealing audience engagement patterns, and highlighting optimization opportunities across campaigns. Through comprehensive data visualization, marketing teams can quickly pivot resources toward successful initiatives, eliminate underperforming tactics, and make strategic adjustments that enhance ROI and competitive positioning.
Best practices for presenting campaign performance data include clear visualizations, executive summaries, trend analysis, ROI metrics, and actionable insights tailored to each stakeholder group. These approaches streamline decision-making by highlighting key performance indicators, comparing against benchmarks, and providing context for results, with many marketing teams finding that stakeholder-specific dashboards ultimately enhance strategic alignment and campaign optimization efforts.
Conversion rates serve as a primary indicator of campaign effectiveness, directly measuring how well campaigns transform audience engagement into desired actions like purchases, sign-ups, or downloads. Higher conversion rates demonstrate successful message resonance and targeting precision, with many marketing teams finding that even modest conversion improvements significantly enhance ROI, customer acquisition costs, and overall campaign profitability.
Real-time data enables marketers to monitor campaign metrics instantly, allowing for immediate adjustments to targeting, budget allocation, and creative elements based on performance trends. This immediacy helps organizations optimize ad spend efficiently, respond to audience behavior changes quickly, and maximize ROI, with many marketing teams finding that real-time insights deliver significantly better campaign outcomes.
Mobile and web analytics differ primarily in tracking methods, user behavior patterns, engagement metrics, and conversion pathways within campaign performance measurement. Mobile analytics focus on app-specific interactions, push notification responses, and location-based targeting, while web analytics emphasize page views, session duration, and cookie-based tracking, with many marketers finding that combining both delivers comprehensive cross-platform campaign insights.
**INPUT**: What benchmarks should campaigns be compared against in the dashboard? **OUTPUT**: Campaign dashboards should compare performance against industry averages, historical campaign data, competitor metrics, seasonal trends, and predetermined KPI targets. These benchmarks enable marketing teams to assess ROI effectiveness, optimize budget allocation, and identify improvement opportunities across channels, with many organizations finding that multi-benchmark comparisons deliver more strategic insights and competitive advantage. [Word count: 54 words]
A campaign performance dashboard facilitates better marketing team collaboration by providing centralized data access, real-time performance visibility, and shared metrics tracking across all team members. With unified reporting capabilities, teams can coordinate campaign adjustments, align on strategic priorities, and make data-driven decisions collectively, ultimately streamlining communication and enhancing overall campaign effectiveness.
User-friendly Campaign Performance Dashboard features include intuitive navigation, customizable widgets, real-time data visualization, automated reporting, and mobile responsiveness. These design elements streamline campaign monitoring by reducing clicks to key metrics, enabling personalized views for different stakeholders, and delivering actionable insights through clear charts and alerts, ultimately enhancing decision-making speed across marketing teams.
-
“Detailed and great to save your time.”
-
They guys always go the extra mile to meet the expectations of their customers. Almost a year has been associated with them.