


Cause And Effect Diagram For Kaizen Training Ppt





Try Before you Buy Download Free Sample Product
 Impress Your
 Audience
 100%
100% Editable
 Save Hours
 of Time


This set of PPT slides in detail covers the Ishikawa Diagrams useability in achieving the continuous improvement objective of Kaizen.
People who downloaded this PowerPoint presentation also viewed the following :
Content of this Powerpoint Presentation
Slide 2
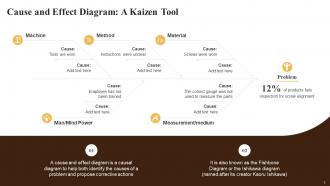
This slide provides information about the cause and effect diagram, i.e., a causal diagram, to help both identify the causes of a problem and propose corrective actions. It is also known as the fishbone diagram or the Ishikawa diagram (named after its creator Kaoru Ishikawa).
Slide 3
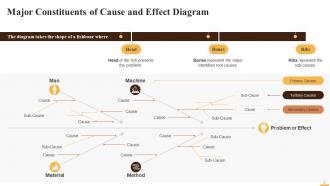
This slide visually presents the fishbone diagram or the Ishikawa diagram highlighting its major constituents i.e. problem, primary, secondary, and tertiary causes.
Slide 4
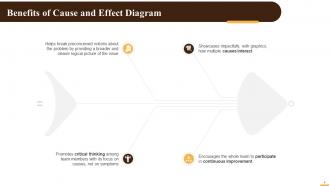
This slide highlights the multiple advantages of the Fishbone Diagram or the Ishikawa diagram, such as promoting critical thinking among team members with its focus on causes, not on symptoms, encouraging the whole team to participate in continuous improvement, etc.
Slide 5
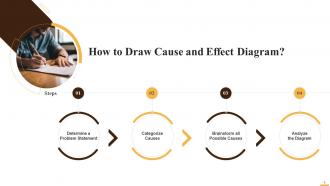
This slide showcase the process of drawing a cause and effect diagram. The major steps are determine a problem statement, categorize causes, brainstorm all possible causes, and analyze the diagram.
Instructor’s Notes:
The major steps to draw a cause and effect diagram are:
- Determine a Problem Statement: Clearly define the business problem and write it at the head of the fish. Then draw a horizontal arrow pointing to the fish head across the page as the fish's backbone
- Categorize Causes: Categorize the problem's causes into groups. The popular frameworks for categorization used are as follows:
- 6Ms: Machine, Methods, Mother Nature, Material, Measurement, Manpower
- 6Ps: People, Process, Policy, Plant, Programs, Products
- 4S: Surroundings, Suppliers, Systems, Skills
Draw categories as the fish's bones with arrows pointing to the backbone
- Brainstorm all Possible Causes: Identify contributing causes to each cause category. Represent these as branches of the fish's bones. Further, identify sub-causes and use these to represent ribs that to show the causal relationships
- Analyze the Diagram: Analyze all major and contributing causes by asking ‘why’ questions and identify the root cause of the problem. If the root cause of the stated problem is still not identified, then shift focus to the diagram area with fewer ideas and continue brainstorming
Cause And Effect Diagram For Kaizen Training Ppt with all 24 slides:
Use our Cause And Effect Diagram For Kaizen Training Ppt to effectively help you save your valuable time. They are readymade to fit into any presentation structure.


















-
It saves your time and decrease your efforts in half.
-
A big thanks to SlideTeam! An incredible and diverse library of templates helped me with my business project presentation.