


Circular chart for financial growth analysis powerpoint slides




Try Before you Buy Download Free Sample Product
 Impress Your
 Audience
 100%
100% Editable
 Save Hours
 of Time


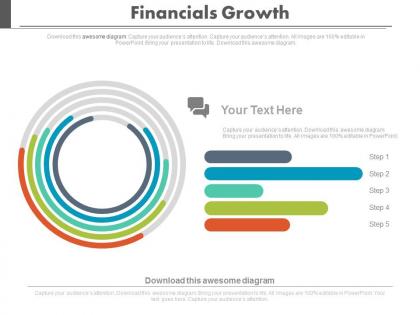
Astonish the viewers with a spellbound graphic presentation to mark your financial growth data. The hard-hitting presentation design is created with utmost finesse to deliver the concise and complete picture of the financial health. Finance being the lifeline of every organization demands a thorough scrutiny, which is the core essence of our Ppt's that articulately communicate with its elegant design to the large audiences at once. Demarcate the areas like growth potential, finance expansion, funds infusion, financial diversification etc to draw the conclusive strategies. The Ppt offers five steps approach to the financial analysis. Adopt a timeless experience with the pre-designed ppt templates to get ready for the business presentations with the investment of minimal time and efforts, acquiring miraculous results with it. The communities bound to gain from the said graphic designs comprise of business executives, financial consultancies, design houses, management trainees, and institutions etc. Adjourn no more to incorporate this flawless weapon to mark a lead over your competitors. Encourage ideas to form afresh. Our Circular Chart For Financial Growth Analysis Powerpoint Slides embolden your thoughts.
People who downloaded this PowerPoint presentation also viewed the following :
Circular chart for financial growth analysis powerpoint slides with all 4 slides:
Our Circular Chart For Financial Growth Analysis Powerpoint Slides enable a conscious effort. Awareness of your brand will develop fast.


FAQs for Circular chart for financial growth
Start with revenue growth - that's your bread and butter for seeing if they're actually expanding. Profit margins are huge too (gross, operating, net) because who cares if they're growing by lighting money on fire, right? Cash flow from operations honestly tells you more than profits sometimes since accounting gets weird. Check their return on equity and return on assets to see if management knows what they're doing with investor money. Don't ignore debt-to-equity ratios either - growth funded by crazy debt usually ends badly. Compare everything over 3-5 years and against competitors so you're not flying blind.
So basically market trends are like a magnifying glass for your growth projections - they'll either pump them up or crush them. You've got to look at industry shifts, how people are spending, the whole economic picture. Tech booming? Your SaaS numbers look great. Interest rates climbing? Real estate forecasts are probably toast. Here's what I actually do though - I run my models against 2-3 different scenarios instead of just picking one trend and hoping for the best. Saves you from getting blindsided when things inevitably go sideways.
Dude, cash flow is everything. Seriously, a company can look profitable on paper but still go under if they can't actually pay their bills. It's like knowing your friend owes you $500 versus having $500 in your wallet right now - timing matters huge. I always look at operating cash flow trends over several quarters, not just one snapshot. If it's consistently positive, that usually means their business model actually works in real life. You can have all the theoretical profits you want, but if cash isn't flowing through the door when you need it? You're screwed.
Look, comparative analysis just gives your numbers actual meaning. Say you hit 15% revenue growth - sounds great, right? But if your competitors are all doing 25%, you're actually falling behind. It helps you figure out if everyone's dealing with the same margin issues or if it's just your company (yikes). You can spot best practices, see what's working for others, and catch problems early. I'd grab financials from like 4-5 similar companies and compare the key ratios each quarter. Without that context, you're basically guessing whether your performance is good or garbage.
Track leading AND lagging indicators - revenue's just part of the story. Cohort analysis shows how different customer groups actually perform over time. Compare against baselines or control groups to see real incremental lift. Honestly, time-boxed experiments save you from those growth projects that just... never end. Customer lifetime value vs acquisition costs is huge, plus factor in what else your team could've worked on instead. Pick 2-3 metrics that directly connect to revenue first. Build everything else around those core numbers. Way easier than trying to measure everything at once.
So economic indicators are basically like checking the weather before you make plans. Strong GDP and low unemployment? Your growth projections can be more aggressive. But when inflation jumps or rates climb, dial it back - borrowing gets expensive and kills expansion. Honestly I think most people overthink this stuff. Just pick 3-4 indicators that actually matter for your industry instead of drowning in every single data point. It's way more manageable that way, and you won't second-guess yourself constantly.
CAC is how much you're spending to snag each new customer. Super important because if you're paying more to acquire them than they'll ever spend with you, you're literally losing money while "growing" - which honestly makes no sense when you think about it. I always tell people to aim for customers who'll bring in at least 3x what you spent getting them over their lifetime. Otherwise you're just burning cash. Track it monthly so you can catch problems early. Oh and compare it to your customer lifetime value - that's where the real magic happens in figuring out if your growth is actually profitable.
Honestly, just dig into your revenue data from the past few years and slice it up differently than usual. Check which customer segments or product lines are actually growing fast - that's where the real opportunities hide. Geographic regions too, sometimes you'll find gold in places you weren't even thinking about. I swear, half the companies I know completely miss obvious expansion chances because they're stuck looking at the same old reports. Watch where your competitors are making moves too. Short version: find what's accelerating and what's underperforming but has potential, then figure out how to scale those revenue streams.
Honestly, debt's kinda like caffeine for your business - awesome in the right doses, disaster if you overdo it. Borrowing for equipment or expansion? Smart move since you're investing before you've actually made the money. But here's the thing - too much debt means you're just bleeding cash on interest payments instead of growing. I learned this the hard way when lenders started getting weird about our numbers. You want your returns to beat whatever you're paying to borrow. Keep an eye on your debt-to-equity ratio and only take on debt that'll actually boost revenue.
So profit margins basically show how much wiggle room a company has for growth stuff. More margin = more cash to throw at expansion, research, buying other companies, whatever. Fat margins usually mean they can scale up without begging for outside money all the time. Thin margins though? That's where things get dicey - they might need loans or dilute shares to grow. Some industries are just brutal on margins but still explode growth-wise (retail is nuts like that). What you really want to watch is whether margins stay steady or get better as they grow. That tells you if they're building something real or just burning cash to look bigger.
Look, tracking your financial growth is basically your early warning system. You'll catch problems way before they blow up by watching revenue trends, cash flow, and key metrics month to month. Honestly, it's probably one of the smartest things you can do as a business owner. When margins start shrinking or your debt ratios get wonky, you'll see it coming. That gives you time to pivot strategies, maybe diversify how you make money, or just stockpile some cash. I'd set up simple monthly dashboards - nothing fancy, just the numbers that actually matter for your business.
Honestly, just start with Excel or Google Sheets - they're still amazing for basic modeling and trends. Python or R are worth learning if you're dealing with huge datasets or need fancy stats. Tableau makes killer visuals that actually mean something (way better than boring spreadsheets). Bloomberg Terminal is obviously the dream but costs a fortune. Here's the thing though - you can do pretty sophisticated growth analysis in Excel if you know your pivot tables and the right formulas. Don't overthink it at first. Use whatever you've got access to and build from there. Power BI's another solid option for dashboards too.
Dude, going international is wild - opens up tons of new customers but also means you're suddenly competing with companies that have way more money than you. Currency stuff can really screw with your profits too, which honestly nobody warns you about enough. You'll probably need to change your pricing and maybe add new products. The competition thing is real though - these global players operate totally differently than what you're used to. My advice? Pick just one country first and see how it goes. Don't try to conquer the world right away or you'll spread yourself too thin.
Honestly, the numbers only tell half the story. Check out who's running the company - do they have a solid track record? How's their market position holding up against competitors? I always look at customer loyalty too, especially for subscription stuff since that's basically their lifeline. Brand strength and regulatory headaches can totally mess with your projections. Oh, and don't ignore whether they can actually scale their operations or if some new tech might disrupt everything. What I do is rate each factor 1-5, then weigh it against the financials. Gives you a way better picture than just spreadsheet magic.
Just take their average monthly spend, multiply by how long they stick around, then minus what it costs to get them. Like if someone drops $100/month for 2 years but costs you $50 upfront - boom, $2,350 CLV. Track this stuff monthly and you'll see which marketing actually works. High CLV customers? Focus your retention there. I honestly think people make this way harder than it needs to be. Compare CLV across different channels too - sometimes your cheapest ads bring in the worst long-term customers.
-
Excellent work done on template design and graphics.
-
Use of icon with content is very relateable, informative and appealing.