


Competitive Landscape Module Powerpoint Presentation Slides




Try Before you Buy Download Free Sample Product
 Impress Your
 Audience
 100%
100% Editable
 Save Hours
 of Time


SlideTeam presents you yet another conventional design for expressing your competitive analysis module. Crafted with comprehensive processes, covering up competitive analysis strategies for determining, choosing, analyzing, and ordering intelligence about goods, buyers, competitors, and various features of the environment needed to maintain administrators and managers in imperative decision making for an institution. Stunning color sequences have been used here for a better engagement and stages have been given a visual impression by using relevant icons. This makes these PPT slide presentation accessible and expressive at a glance. Graphics of bar graphs, line charts scatter plots, pie charts, relatable mages and icons, family charts and linear processes are few to mention concepts used in these PowerPoint designs to make your work more amendable. The stages in this process are the competitive analysis module, a competitive landscape module, competitive assessment Module. Download this presentation for an enduring prfessionalism and leave a definite impression while describing your business agendas through these grand PowerPoint design. Get ignited now. Create an awesome group with our Competitive Landscape Module Powerpoint Presentation Slides. Everyone's brains will be bursting with ideas.
People who downloaded this PowerPoint presentation also viewed the following :
Content of this Powerpoint Presentation
Slide 1: This slide introduces Competitive Landscape Module. State Your Company Name and begin.
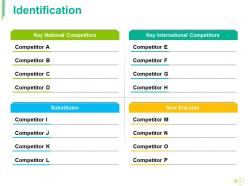
Slide 2: This slide present Identification table showing- Key National Competitors, Substitutes, Key International Competitors, New Entrants.
Slide 3: This slide presents Logos of Competitors with icon imagery.
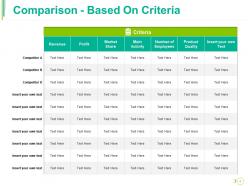
Slide 4: This slide shows Comparison - Based On Criteria in tabular form.
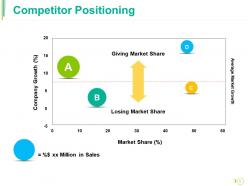
Slide 5: This slide shows Competitor Positioning with- Losing Market Share, Giving Market Share, Market Share (%), Average Market Growth, Company Growth (%).
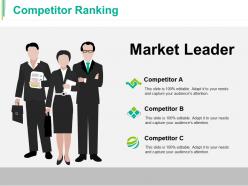
Slide 6: This slide shows Competitor Ranking with Market Leader.
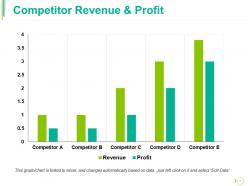
Slide 7: This slide presents Competitor Revenue & Profit in graph form.
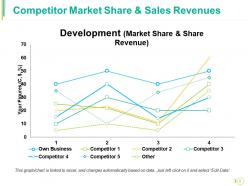
Slide 8: This slide presents Competitor Market Share & Sales Revenues in line graph form.
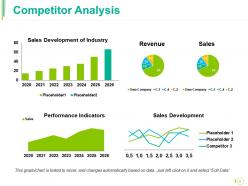
Slide 9: This slide presents charts and graphs for Competitor Analysis.
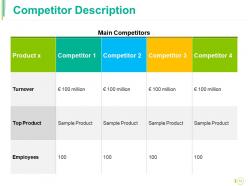
Slide 10: This slide elaborates Competitor Description in tabular form.
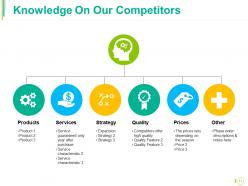
Slide 11: This slide shows Knowledge On Our Competitors with the following subheadings- Services, Expansion, Strategy, Quality, Prices, Other.
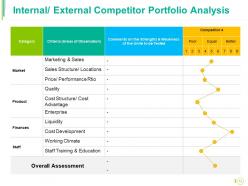
Slide 12: This slide shows Internal/ External Competitor Portfolio Analysis.
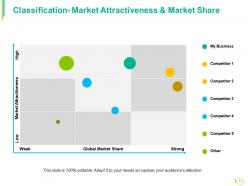
Slide 13: This slide displays Classification- Market Attractiveness & Market Share showing- Market Attractiveness, Global Market Share.
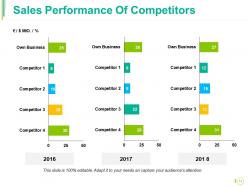
Slide 14: This slide displays Sales Performance Of Competitors in bar graph form.
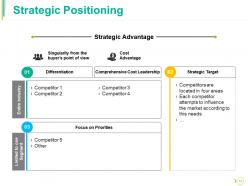
Slide 15: This slide shows Strategic Positioning with the following content- Strategic Advantage, Strategic Target, Other, Differentiation, Cost Advantage.
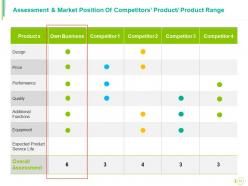
Slide 16: This slide presents Assessment & Market Position Of Competitors’ Product/ Product Range.
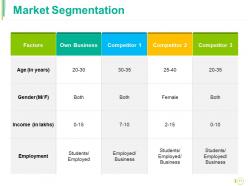
Slide 17: This is a Market Segmentation slide in tabular form.
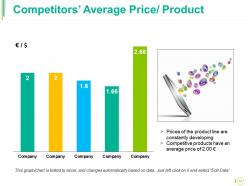
Slide 18: This slide presents Competitors’ Average Price/ Product in graph form.
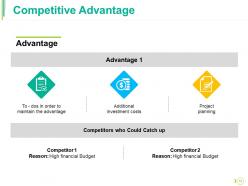
Slide 19: This is a Competitive Advantage slide showcasing advantages and competitors facts.
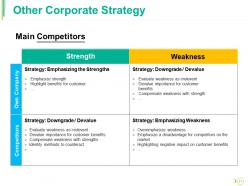
Slide 20: This slide shows Other Corporate Strategy with the main subheading-0 Main Competitors divided into: Strength, Weakness, Own Company, Competitors.
Slide 21: This slide shows Other Corporate Strategy with the main subheading-0 Main Competitors divided into: Strength, Weakness, Own Company, Competitors.
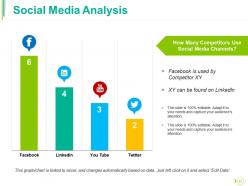
Slide 22: This is a Social Media Analysis graph slide.
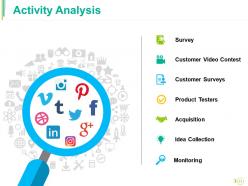
Slide 23: This slide shows Activity Analysis with- Survey, Customer Video Contest, Customer Surveys, Product Testers, Acquisition, Idea Collection, Monitoring.
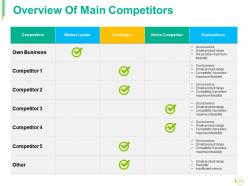
Slide 24: This slide presents Overview Of Main Competitors in tabular form.
Slide 25: This is a Coffee Break slide to halt. You can change the content as per need.
Slide 26: This slide is titled Charts and Graphs to move forward. You can change the slide content as per need.
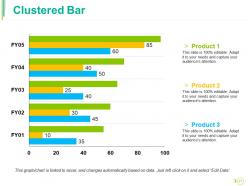
Slide 27: This is a Clustered Bar slide. State specifications, comparison of products/entities here.
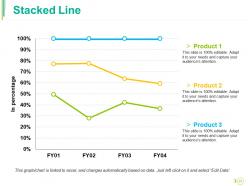
Slide 28: This is a Stacked Line Graph slide. State specifications, comparison of products/entities here.
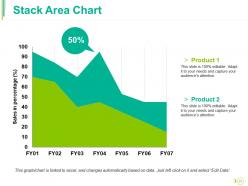
Slide 29: This is a Stack Area chart slide. State specifications, comparison of products/entities here.
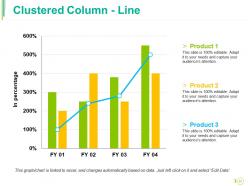
Slide 30: This is a Clustered Column- Line chart slide. State specifications, comparison of products/entities here.
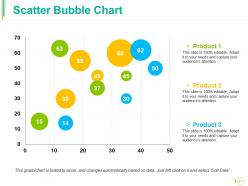
Slide 31: This is a Scatter Bubble chart slide. State specifications, comparison of products/entities here.
Slide 32: This slide is titled Additional Slides to move forward. You can change the slide content as per need.
Slide 33: his is Our Mission slide with Vision and Goals. State them here.
Slide 34: This is Our Team slide with names, designation and text boxes to fill information.
Slide 35: This is an About Our Company slide. State company/team specifications here.
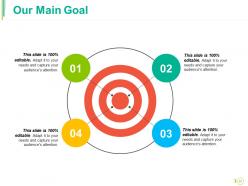
Slide 36: This is Our Main Goal slide. State your goals here.
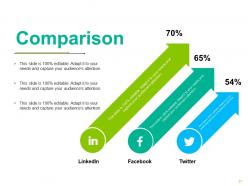
Slide 37: This is a Comparison slide in creative arrow form. State comparison, specifications etc. here.
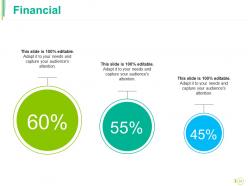
Slide 38: This is a Financial score slide to state financial aspects etc.
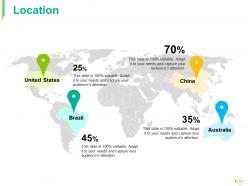
Slide 39: This is a Location slide of world map image. Mark specific locations for company growth, market etc. here.
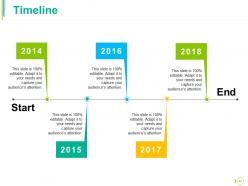
Slide 40: This slide showcases a Timeline to show milestones, important highlights, business journey etc.
Slide 41: This is a Quotes slide to show something you want to convey. You may change the slide content as required.
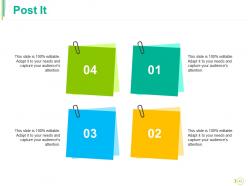
Slide 42: This is a Post It Notes slide to show important information, events etc. Pin your information here.
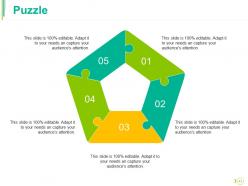
Slide 43: This is a Puzzle image slide. State information, specifications etc. here.
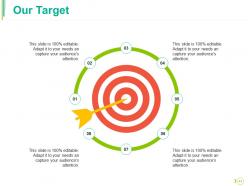
Slide 44: This is Our Target slide. State your targets here.
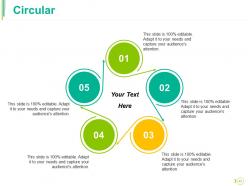
Slide 45: This is a Circular image slide to show information, specifications etc.
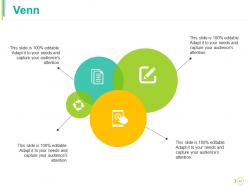
Slide 46: This is a Venn diagram image slide to show information, specifications etc.
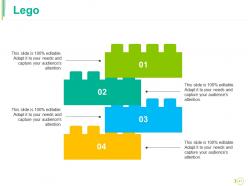
Slide 47: This is a Lego image slide. State information, specifications etc. here.
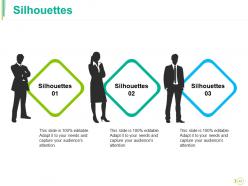
Slide 48: This slide shows Silhouettes with text boxes. State people related information, specifications etc. here.
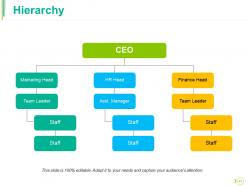
Slide 49: This is a Hierarchy slide. State team/department, organization information, specifications etc. here.
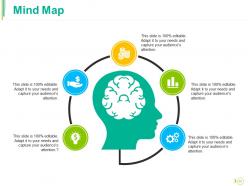
Slide 50: This is a Mind Map image slide to show segmentation, information, specifications etc.
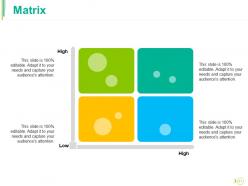
Slide 51: This is a Matrix chart slide. Put relevant comparison data here.
Slide 52: This is a Magnifying Glass image slide to show information, specifications etc.
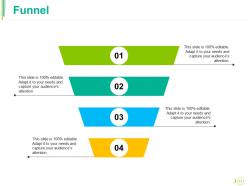
Slide 53: This is a Funnel slide to show funneling aspects etc.
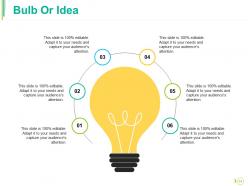
Slide 54: This is a Bulb or Idea image slide to show ideas, innovative information etc.
Slide 55: This is a Thank You slide with Address# street number, city, state, Contact Numbers, Email Address.
Competitive Landscape Module Powerpoint Presentation Slides with all 55 slides:
Our Competitive Landscape Module Powerpoint Presentation Slides guarantee good appearance. Your thoughts acquire added embellishment.










FAQs for Competitive Landscape Module
Key factors defining competitive landscape include market share distribution, pricing strategies, product differentiation, technological capabilities, customer loyalty metrics, and regulatory barriers to entry. These elements interact dynamically across sectors like telecommunications, healthcare, and financial services, with companies leveraging strategic positioning, innovation cycles, and operational efficiency to secure sustainable competitive advantages in increasingly complex markets.
Businesses can effectively analyze competitors by leveraging competitive landscape modules that systematically map market positioning, pricing strategies, product portfolios, customer segments, and operational capabilities. These modules enable organizations to identify market gaps, benchmark performance metrics, and assess competitive threats through data visualization and strategic frameworks, ultimately delivering actionable insights that inform positioning decisions and reveal untapped opportunities for competitive advantage.
Market segmentation enables businesses to identify distinct customer groups, analyze competitor positioning within each segment, assess market share distribution, and uncover underserved niches for strategic advantage. Through targeted segmentation analysis, organizations can tailor competitive strategies, optimize resource allocation, and differentiate offerings more effectively, with many companies finding that segment-specific approaches deliver superior market penetration and customer acquisition results.
Visual elements enhance competitive landscape analysis by transforming complex data into clear charts, positioning maps, comparison matrices, and infographics that highlight market gaps and opportunities. These visual tools enable stakeholders to quickly identify competitive advantages, market positioning, and strategic insights, with many organizations finding that visual presentations accelerate decision-making and improve strategic planning effectiveness.
Essential metrics include market share, revenue growth, pricing strategies, product portfolio breadth, customer satisfaction scores, and digital presence strength. These indicators enable comprehensive competitor assessment by revealing market positioning, financial performance, and strategic direction, with many organizations finding that combining quantitative data with qualitative insights delivers more accurate competitive intelligence and strategic advantage.
Technological advancements reshape competitive dynamics by enabling new business models, reducing operational costs, and creating differentiation opportunities through innovation. Companies leveraging automation, data analytics, and digital platforms can deliver faster services, enhanced customer experiences, and more efficient operations, while organizations slow to adopt risk losing market share in increasingly technology-driven industries.
Common pitfalls include overemphasizing direct competitors while ignoring emerging threats, relying on outdated data, focusing solely on product features rather than customer value propositions, and making assumptions without validating market intelligence. These analytical blind spots can mislead strategic decisions, with many organizations finding that comprehensive, regularly updated competitive assessments enable more accurate market positioning and sustainable competitive advantages.
Businesses should update their Competitive Landscape Module quarterly, with critical updates made immediately when major market shifts, new competitors, or significant product launches occur. This strategic cadence enables organizations to maintain accurate market positioning, anticipate competitive threats, and capitalize on emerging opportunities, with many leading companies finding that regular updates enhance decision-making speed and market responsiveness significantly.
Tools for creating effective Competitive Landscape Modules include competitive intelligence platforms like SEMrush and Ahrefs, market research software such as CB Insights and Crunchbase, data visualization tools like Tableau and Power BI, and presentation platforms including SlideTeam's templates. These technologies streamline competitor analysis by automating data collection, enhancing market insights, and delivering comprehensive visual frameworks, ultimately enabling organizations to identify opportunities and maintain competitive advantage.
The Competitive Landscape Module assists in identifying market opportunities by analyzing competitor positioning, market gaps, pricing strategies, and customer segments through comprehensive data visualization and strategic mapping. Through detailed competitor profiling and market analysis frameworks, organizations can uncover underserved niches, pricing advantages, and differentiation opportunities, ultimately enabling strategic positioning that delivers competitive advantage and accelerated market entry.
A competitive SWOT analysis should include competitors' market share, financial performance, product portfolios, technological capabilities, brand reputation, and distribution networks as key assessment areas. This strategic evaluation enables organizations to identify market gaps, benchmark their own capabilities, and develop targeted competitive strategies, with many businesses finding that comprehensive competitor analysis ultimately delivers enhanced positioning and sustainable competitive advantage.
Companies leverage Competitive Landscape Module insights to identify market gaps, benchmark performance against rivals, and uncover emerging opportunities that shape strategic priorities. These insights enable organizations to refine positioning strategies, optimize resource allocation, and accelerate product development timelines, with many enterprises finding that systematic competitor analysis ultimately delivers enhanced market differentiation and sustainable competitive advantage.
Customer feedback serves as a critical competitive intelligence source, influencing product development, service improvements, market positioning, and strategic decision-making across industries. Through social media monitoring, review analysis, and direct surveys, companies like retail chains and financial services firms identify market gaps, anticipate competitor moves, and enhance customer experiences, ultimately delivering stronger market differentiation and competitive advantage.
A Competitive Landscape Module for emerging markets emphasizes growth potential, regulatory adaptability, and local partnerships, while established markets focus on market share analysis, mature competitor positioning, and differentiation strategies. Through customized market segmentation and risk assessment frameworks, organizations can navigate varying competitive intensities, regulatory environments, and consumer behaviors, ultimately delivering targeted insights that enhance strategic decision-making and competitive advantage.
Effective competitive data visuals include comparison matrices, radar charts, positioning maps, bar charts for market share, and SWOT analysis grids. These formats streamline complex competitor information by highlighting relative strengths, market positioning, and performance gaps, with many organizations finding that visual matrices and positioning maps deliver clearer strategic insights for competitive advantage.
-
Excellent work done on template design and graphics.
-
Informative presentations that are easily editable.