


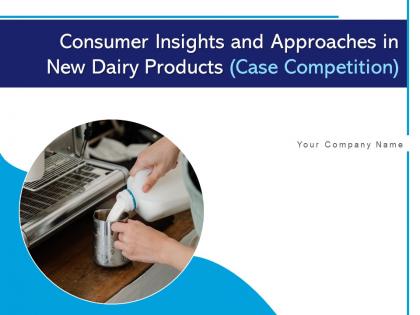
Consumer insights and approaches in new dairy products case competition complete deck


Try Before you Buy Download Free Sample Product
 Impress Your
 Audience
Editable
of Time


Consumer perception towards dairy products can be positive and negative, which are affected by the companys strategies. In todays world of increasing competition, where numerous brands sell the same products, consumers have abundant choices, and many different factors affect their buying behavior. Here is a professionally designed pitch deck on Consumer Insights and Approaches in New Dairy Products to resolve all the issues faced by the industry. This will help the companies identify the new strategies, recommendations, and solutions to overcome the challenges, i.e. the decline in dairy product sales due to customers perception of dairy products. These strategies might help the company to positively shift the customers perception towards the companys dairy products and help boost the sales of the products. Using graphs and charts, one can mention total worldwide sales of their dairy product companys sales, revenue, and other elements data. This pitch deck covers company revenue and market share after successfully implementing the plan. It also covers the financial forecasts with dairy products sales forecasts for the next five years and dashboards related to dairy companies. Download the pitch deck and connect with us now. Talk to our experts for all your queries and access the pitch deck for consumer approaches to new dairy products.
People who downloaded this PowerPoint presentation also viewed the following :
Content of this Powerpoint Presentation
Slide 1: This slide introduces Consumer Insights and Approaches in New Dairy Products. State Your Company Name and begin.
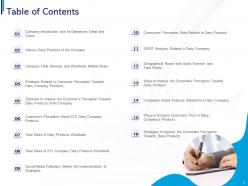
Slide 2: This slide shows Table of Content for the presentation.
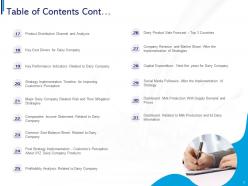
Slide 3: This is another slide continuing Table of Content for the presentation.
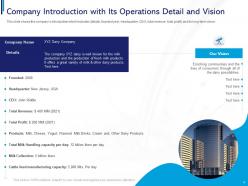
Slide 4: This slide presents Company Introduction with Its Operations Detail and Vision.
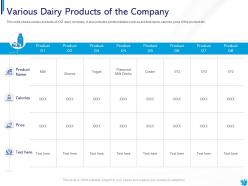
Slide 5: This slide displays Various Dairy Products of the Company.
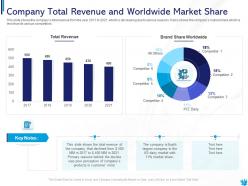
Slide 6: This slide represents Company Total Revenue and Worldwide Market Share.
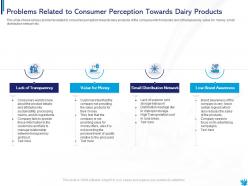
Slide 7: This slide showcases Problems Related to Consumer Perception Towards Dairy Products.
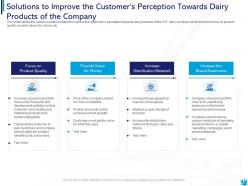
Slide 8: This slide shows Solutions to Improve the Customer’s Perception Towards Dairy Products of the Company.
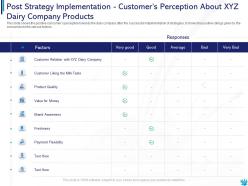
Slide 9: This slide describes the customer’s perception towards the XYZ dairy company.
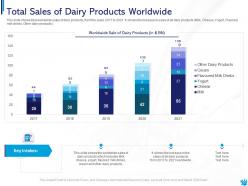
Slide 10: This slide presents total worldwide sales of dairy products.
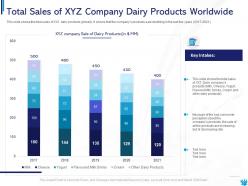
Slide 11: This slide displays Total Sales of XYZ Company Dairy Products Worldwide.
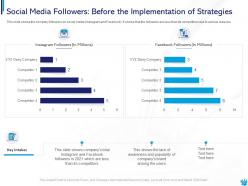
Slide 12: This slide represents Social Media Followers: Before the Implementation of Strategies.
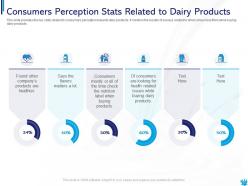
Slide 13: This slide showcases Consumers Perception Stats Related to Dairy Products.
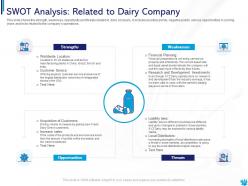
Slide 14: This slide shows the strength, weakness, opportunity and threats related to dairy company.
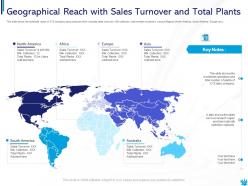
Slide 15: This slide presents Geographical Reach with Sales Turnover and Total Plants.
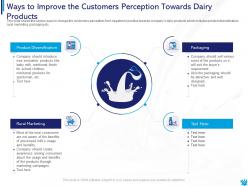
Slide 16: This slide displays Ways to Improve the Customers Perception Towards Dairy Products.
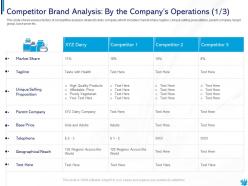
Slide 17: This slide represents Competitor Brand Analysis: By the Company’s Operations.
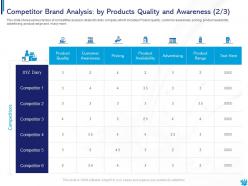
Slide 18: This slide showcases various factors of competitive analysis related to dairy company.
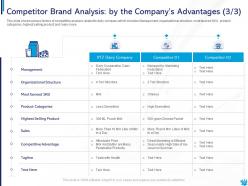
Slide 19: This slide shows Competitor Brand Analysis: by the Company’s Advantages.
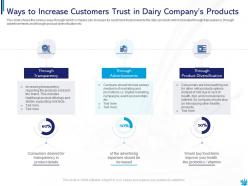
Slide 20: This slide presents Ways to Increase Customers Trust in Dairy Company’s Products.
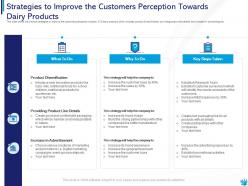
Slide 21: This slide displays Strategies to Improve the Customers Perception Towards Dairy Products.
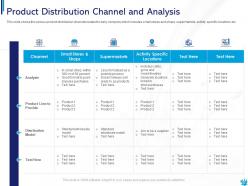
Slide 22: This slide represents the various product distribution channels related to dairy company.
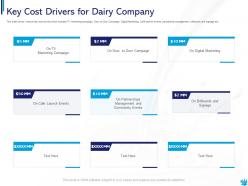
Slide 23: This slide showcases Key Cost Drivers for Dairy Company.
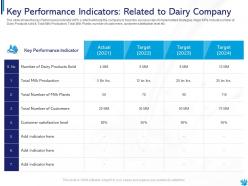
Slide 24: This slide shows Key Performance Indicators: Related to Dairy Company.
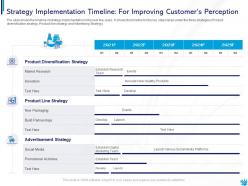
Slide 25: This slide presents Strategy Implementation Timeline: For Improving Customer’s Perception.
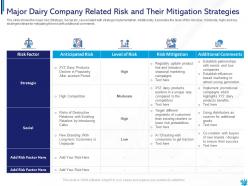
Slide 26: This slide displays Major Dairy Company Related Risk and Their Mitigation Strategies.
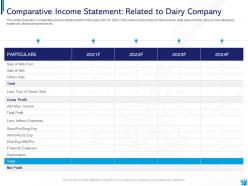
Slide 27: This slide represents Comparative Income Statement: Related to Dairy Company.
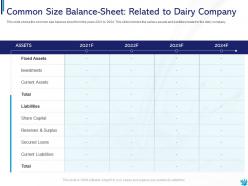
Slide 28: This slide showcases Common Size Balance-Sheet: Related to Dairy Company.
Slide 29: This slide shows the positive consumer’s perception towards the dairy company after the successful implementation of strategies.
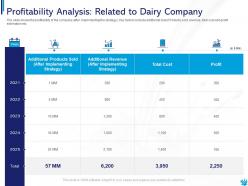
Slide 30: This slide presents Profitability Analysis: Related to Dairy Company.
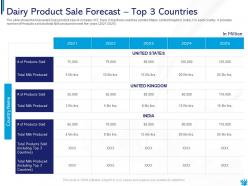
Slide 31: The slide displays the forecasted Dairy product sale of company XYZ Dairy.
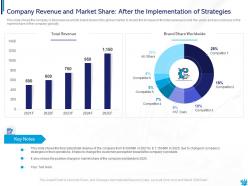
Slide 32: This slide represents Company Revenue and Market Share: After the Implementation of Strategies.
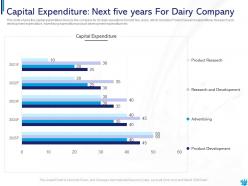
Slide 33: This slide showcases the capital expenditure done by the company for its daily operations.
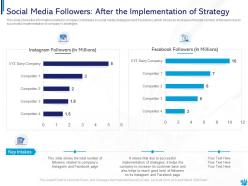
Slide 34: This slide shows Social Media Followers: After the Implementation of Strategy.
Slide 35: This slide presents the dashboards which includes the information related to Milk production.
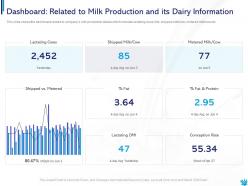
Slide 36: This slide displays Dashboard: Related to Milk Production and its Dairy Information.
Slide 37: This slide represents Icons for Consumer Insights and Approaches in New Dairy Products.
Slide 38: This slide is titled as Additional Slides for moving forward.
Slide 39: This is About Us slide to show company specifications etc.
Slide 40: This is an Idea Generation slide to state a new idea or highlight information, specifications etc.
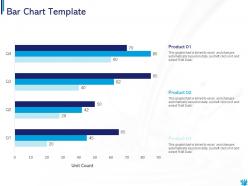
Slide 41: This slide displays Bar Chart Template with three products comparison.
Slide 42: This slide shows Venn diagram with text boxes.
Slide 43: This slide presents Roadmap with additional textboxes.
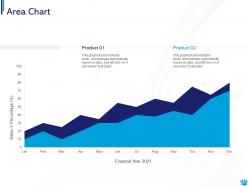
Slide 44: This slide displays Area chart with two products comparison.
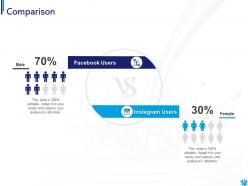
Slide 45: This is a Comparison slide to state comparison between commodities, entities etc.
Slide 46: This slide shows Puzzle with related icons and text.
Slide 47: This is a Timeline slide. Show data related to time intervals here.
Slide 48: This slide shows Post It Notes. Post your important notes here.
Slide 49: This is a Thank You slide with address, contact numbers and email address.
Consumer insights and approaches in new dairy products case competition complete deck with all 49 slides:
Use our Consumer Insights And Approaches In New Dairy Products Case Competition Complete Deck to effectively help you save your valuable time. They are readymade to fit into any presentation structure.


-
Easily Understandable slides.
-
Graphics are very appealing to eyes.
-
Qualitative and comprehensive slides.
-
Best way of representation of the topic.
-
Out of the box and creative design.