


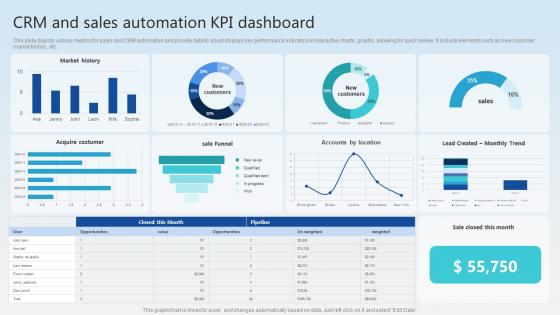
CRM And Sales Automation KPI Dashboard




Try Before you Buy Download Free Sample Product
 Impress Your
 Audience
 100%
100% Editable
 Save Hours
 of Time


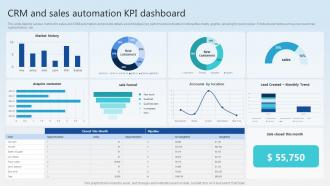
This slide depicts various metrics for sales and CRM automation and provide details about displays key performance indicators in interactive charts, graphs, allowing for quick review. It include elements such as new customer, market history, etc.
People who downloaded this PowerPoint presentation also viewed the following :
CRM And Sales Automation KPI Dashboard with all 10 slides:
Use our CRM And Sales Automation KPI Dashboard to effectively help you save your valuable time. They are readymade to fit into any presentation structure.








FAQs for CRM And Sales
Effective CRM dashboards should display sales pipeline metrics, customer acquisition costs, conversion rates, customer lifetime value, lead response times, and retention rates. These metrics enable sales teams to track performance, identify bottlenecks, and optimize customer relationships, with many organizations finding that comprehensive dashboard visibility drives faster decision-making and improved revenue outcomes.
Data visualization improves CRM decision-making by transforming complex customer data into clear charts, graphs, and interactive dashboards that reveal patterns, trends, and actionable insights instantly. Through visual analytics, sales teams can identify high-value prospects, track pipeline performance, and optimize customer engagement strategies more effectively, ultimately delivering faster responses and enhanced customer experiences.
Customizing CRM dashboards for different user roles delivers targeted visibility, enhanced productivity, improved decision-making, streamlined workflows, and reduced information overload. Sales managers gain pipeline insights and performance metrics, while customer service representatives access case histories and resolution tools, ultimately enabling faster responses, better customer experiences, and strategic resource allocation across organizations.
CRM dashboards should be updated in real-time or daily to maintain accuracy, depending on your business needs, data complexity, and integration capabilities. Organizations with high-volume sales activities often benefit from real-time updates, while others find daily refreshes sufficient, ultimately delivering current insights that enhance decision-making and customer relationship management effectiveness.
Common CRM dashboard pitfalls include overcrowding with excessive data, poor visual hierarchy, lack of user-specific customization, slow loading times, and unclear KPI definitions. These design flaws significantly reduce user adoption and decision-making effectiveness, with many sales teams finding that streamlined, role-based dashboards enhance productivity and deliver faster customer insights.
Integration with other systems enhances CRM dashboard functionality by consolidating data from marketing automation, accounting, customer support, and inventory management platforms into unified views. This strategic combination enables sales teams to access comprehensive customer histories, track cross-platform interactions, and make informed decisions faster, ultimately delivering improved customer experiences and operational efficiency.
User feedback plays a crucial role in optimizing CRM dashboards by identifying pain points, revealing workflow inefficiencies, and highlighting missing functionalities that impact daily operations. This input enables organizations to streamline interface design, enhance data visualization relevance, and customize features for specific roles, with many sales teams finding that feedback-driven optimizations significantly improve adoption rates and ultimately deliver faster deal closure and enhanced productivity.
**INPUT**: How do you prioritize which data to present on a CRM dashboard? **OUTPUT**: Prioritize CRM dashboard data by focusing on metrics that directly impact revenue, customer retention, conversion rates, and team productivity goals. Start with sales pipeline stages, lead conversion metrics, and customer lifetime value, while incorporating role-specific KPIs for different users, ultimately delivering actionable insights that enable faster decision-making and improved performance outcomes. --- **Word count**: 55 words ✓
Mobile-friendly CRM dashboard best practices include responsive design, simplified navigation, touch-optimized controls, prioritized key metrics, and offline functionality. These approaches enhance user experience by streamlining data access, reducing screen clutter, and enabling field sales teams to update customer information seamlessly, with many organizations finding that mobile optimization significantly improves adoption rates and real-time decision-making capabilities.
AI and machine learning enhance CRM dashboard analytics by enabling predictive customer behavior modeling, automated lead scoring, and intelligent sales forecasting. These technologies streamline data analysis through pattern recognition, anomaly detection, and personalized recommendations, with many financial services and retail organizations finding that ML-driven insights ultimately deliver faster decision-making and improved customer relationship management.
Essential security measures include multi-factor authentication, role-based access controls, data encryption, regular security audits, and secure API integrations. These protocols streamline data protection by restricting unauthorized access, encrypting customer information, and monitoring suspicious activities, with many financial services and healthcare organizations finding that comprehensive security frameworks ultimately deliver enhanced customer trust and regulatory compliance.
Historical data trends can be effectively represented through line charts tracking sales performance over time, heat maps showing seasonal customer activity patterns, comparative bar charts displaying year-over-year growth metrics, and trend indicators highlighting pipeline progression. These visualizations enable sales teams to identify patterns, forecast future performance, and make data-driven strategic decisions, with many organizations finding that clear trend representation ultimately enhances forecasting accuracy and competitive positioning.
Features that enhance user engagement with a CRM dashboard include customizable widgets, real-time data visualization, interactive analytics, mobile responsiveness, and personalized user interfaces. These capabilities streamline workflow management by enabling sales teams to track performance metrics, monitor customer interactions, and access critical insights seamlessly, ultimately delivering improved productivity and faster decision-making across organizations.
CRM dashboards support sales forecasting and pipeline management by visualizing deal progression, tracking conversion rates, and analyzing historical sales patterns in real-time. These platforms enable sales teams to identify bottlenecks, prioritize high-value opportunities, and adjust strategies based on predictive analytics, ultimately delivering more accurate revenue projections and improved sales performance.
A well-designed CRM dashboard enhances team collaboration by providing shared visibility into customer interactions, lead statuses, pipeline progress, and performance metrics across departments. With centralized, real-time data access, sales, marketing, and customer service teams can coordinate more effectively, avoid duplicate efforts, and maintain consistent customer communications, ultimately streamlining workflows and improving response times.
-
Superb! The innovative and inspiring template designs provide an edge to the presentation.
-
Appreciate the research and its presentable format.