


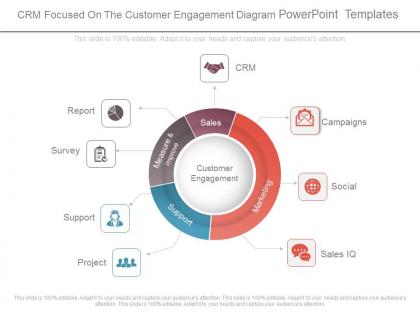
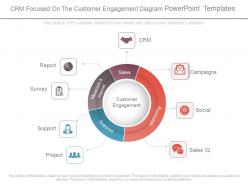
Crm focused on the customer engagement diagram powerpoint templates




Try Before you Buy Download Free Sample Product
 Impress Your
 Audience
 100%
100% Editable
 Save Hours
 of Time


Create the effect you desire. Brush up your thoughts with our Crm Focused On The Customer Engagement Diagram Powerpoint Templates.
People who downloaded this PowerPoint presentation also viewed the following :
Crm focused on the customer engagement diagram powerpoint templates with all 7 slides:
Avoid acting in haste with our Crm Focused On The Customer Engagement Diagram Powerpoint Templates. Don't allow effort to go to waste.
FAQs for Crm focused on the customer engagement
Key components include customer touchpoints, engagement channels, data integration workflows, feedback loops, and performance metrics tracking systems. These elements work together by mapping customer interactions across multiple platforms, enabling personalized communication strategies, and streamlining response processes, with many organizations finding that comprehensive engagement diagrams ultimately deliver improved customer satisfaction and increased retention rates.
PowerPoint templates enhance customer engagement strategy presentations by providing structured frameworks for data visualization, journey mapping, touchpoint analysis, and ROI demonstrations, while ensuring consistent branding and professional design standards. These templates enable organizations to effectively communicate complex engagement metrics, showcase multi-channel strategies, and present actionable insights to stakeholders, ultimately streamlining presentation development and delivering more compelling, data-driven proposals.
Visual elements should include clear customer journey stages, interaction touchpoints across channels, data flow indicators, engagement metrics dashboards, and role-based access pathways. These components enhance comprehension by mapping customer lifecycles, communication channels, and performance indicators, with many organizations finding that well-structured diagrams streamline team alignment and improve customer experience strategies.
Different customer engagement models significantly influence CRM diagram design by determining relationship mapping structures, touchpoint visualization approaches, communication flow patterns, and interaction complexity levels. These models shape whether diagrams emphasize linear customer journeys, omnichannel integration, or relationship-centric approaches, with many organizations finding that subscription-based models require different visual frameworks than transactional models, ultimately delivering clearer strategic alignment and enhanced user adoption.
Data analysis plays a crucial role by identifying customer behavior patterns, preferences, segmentation opportunities, and engagement touchpoints that inform strategic decision-making in PowerPoint presentations. Through comprehensive analytics, organizations can create data-driven engagement strategies that enhance customer experiences, optimize marketing campaigns, and improve retention rates, with many companies finding that visual data representation in PowerPoint enables better stakeholder alignment and strategic implementation.
Organizations can customize CRM PowerPoint templates by modifying customer journey stages, incorporating brand-specific touchpoints, adjusting metrics dashboards, and tailoring engagement workflows to reflect their unique sales processes. Through strategic customization of visual elements, data fields, and process flows, companies across retail, healthcare, and financial services can transform generic templates into powerful tools that showcase their customer relationship strategies, ultimately delivering more compelling presentations and clearer stakeholder alignment.
Best practices for presenting CRM customer engagement data include using clear visualizations like journey maps and funnel charts, segmenting data by customer demographics or behavior patterns, highlighting key performance indicators through dashboard formats, and telling a cohesive story that connects metrics to business outcomes. These approaches enable stakeholders to quickly grasp customer touchpoint effectiveness, retention trends, and revenue impact, ultimately delivering actionable insights that drive strategic decision-making and competitive advantage.
CRM customer engagement diagrams facilitate better understanding of customer journeys by mapping touchpoints, visualizing interaction flows, identifying pain points, tracking engagement stages, and highlighting decision moments throughout the customer lifecycle. These visual tools enable organizations to streamline communication strategies, optimize resource allocation, and enhance customer experiences, with many businesses finding that comprehensive journey mapping ultimately delivers improved retention rates and competitive advantage.
Animations and transitions enhance customer engagement storytelling by highlighting key metric progressions, drawing attention to conversion funnels, and creating visual flow between engagement stages. These dynamic elements help audiences follow complex customer journeys more intuitively, with many sales and marketing teams finding that animated dashboards significantly improve stakeholder comprehension and retention during presentations.
When designing CRM customer engagement diagrams, avoid overcomplicated flows, unclear touchpoint definitions, missing feedback loops, inconsistent terminology, and neglecting mobile interactions. These pitfalls can confuse stakeholders and misrepresent actual customer journeys, with many organizations finding that simplified, well-labeled diagrams enhance team alignment and strategic decision-making across departments.
User feedback shapes CRM PowerPoint template creation by identifying specific pain points, preferred visual formats, and real-world use case requirements through surveys, usage analytics, and stakeholder interviews. Through continuous feedback loops, template designers can enhance data visualization clarity, streamline navigation flows, and incorporate industry-specific metrics, ultimately delivering more intuitive presentations that resonate with sales teams and executives.
**INPUT**: What trends in customer engagement should be reflected in contemporary CRM diagrams? **OUTPUT**: Contemporary CRM diagrams should reflect omnichannel integration, AI-powered personalization, real-time analytics, automated workflows, and social media engagement tracking. These elements enable organizations to streamline customer interactions across multiple touchpoints, with retail and financial services finding that visual representation of these interconnected systems enhances team alignment and ultimately delivers more cohesive customer experiences. [Word count: 54 words]
Color psychology significantly influences customer engagement presentations by enhancing emotional connection, improving information retention, and guiding audience attention through strategic visual hierarchy. Through carefully selected color schemes, organizations can reinforce brand identity, communicate urgency or trust, and create more memorable experiences, with many businesses finding that consistent color application across CRM presentations ultimately delivers stronger client relationships and improved conversion rates.
Additional resources that complement CRM customer engagement diagrams include customer journey maps, persona templates, engagement metrics dashboards, conversion funnel visualizations, and touchpoint analysis charts. These supplementary materials enhance presentations by providing comprehensive context around customer interactions, enabling teams to visualize the complete engagement ecosystem while demonstrating clear pathways from initial contact to loyalty, ultimately delivering stronger strategic insights.
Businesses can measure customer engagement effectiveness through key performance indicators like customer lifetime value, retention rates, Net Promoter Scores, conversion metrics, and interaction frequency across touchpoints. Visual CRM dashboards enable organizations to track these metrics in real-time, with many companies finding that comprehensive engagement mapping ultimately delivers improved customer experiences and increased revenue growth.
-
Good research work and creative work done on every template.
-
Great experience, I would definitely use your services further.