


CRM Marketing Pipeline KPI Dashboard CRM Marketing Guide To Enhance MKT SS




Try Before you Buy Download Free Sample Product
 Impress Your
 Audience
 100%
100% Editable
 Save Hours
 of Time


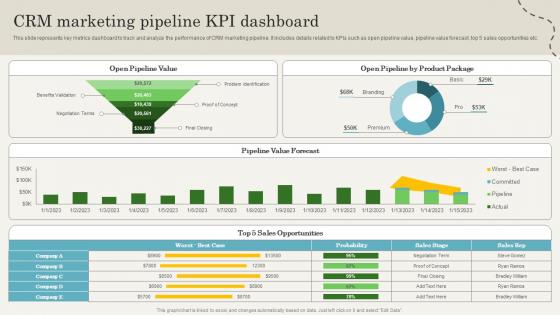
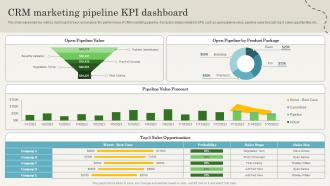
This slide represents key metrics dashboard to track and analyze the performance of CRM marketing pipeline. It includes details related to KPIs such as open pipeline value, pipeline value forecast, top 5 sales opportunities etc.
People who downloaded this PowerPoint presentation also viewed the following :
CRM Marketing Pipeline KPI Dashboard CRM Marketing Guide To Enhance MKT SS with all 7 slides:
Use our CRM Marketing Pipeline KPI Dashboard CRM Marketing Guide To Enhance MKT SS to effectively help you save your valuable time. They are readymade to fit into any presentation structure.





FAQs for CRM Marketing Pipeline KPI Dashboard CRM Marketing Guide To
CRM marketing pipeline KPI dashboards should include lead conversion rates, cost per acquisition, pipeline velocity, lead scoring metrics, and customer lifetime value. These metrics enable marketing teams to track performance across acquisition channels, optimize campaign effectiveness, and identify bottlenecks, with many organizations finding that comprehensive pipeline visibility ultimately delivers improved ROI and accelerated sales cycles.
Visualization techniques enhance KPI understanding by transforming complex data into intuitive charts, graphs, heat maps, and trend lines that reveal patterns instantly. Through color coding, comparative displays, and interactive elements, marketing teams streamline performance analysis, identify bottlenecks faster, and make data-driven decisions more efficiently, ultimately delivering improved campaign outcomes and strategic advantage.
Effective lead conversion tracking within CRM dashboards includes conversion funnel visualization, stage-by-stage conversion percentages, source attribution analysis, time-to-conversion metrics, and automated alerts for conversion anomalies. These tracking mechanisms streamline performance monitoring by identifying bottlenecks, optimizing high-performing channels, and enabling real-time adjustments, with many sales organizations finding that comprehensive conversion analytics ultimately delivers improved forecasting accuracy and enhanced revenue growth.
Sales funnel stages directly determine which metrics appear in KPI dashboards by tracking lead progression from awareness through conversion, with early stages focusing on volume metrics like leads generated and middle stages emphasizing qualification rates. Advanced stages showcase conversion metrics, close rates, and revenue attribution, enabling sales teams to identify bottlenecks, optimize resource allocation, and ultimately accelerate pipeline velocity while improving forecasting accuracy across organizations.
B2B marketing pipelines emphasize longer sales cycles with KPIs like lead scoring, account-based metrics, customer lifetime value, and multi-touch attribution tracking. B2C pipelines focus on higher-volume, faster conversions through conversion rates, cost per acquisition, social engagement metrics, and immediate purchase behaviors, with many organizations finding that B2B requires deeper relationship tracking while B2C prioritizes transaction velocity and broader reach optimization.
Automation tools enhance CRM KPI dashboard accuracy by eliminating manual data entry errors, ensuring real-time synchronization across systems, and standardizing data formats consistently. Through automated lead scoring, contact updates, and pipeline tracking, sales teams receive reliable metrics for decision-making, while reducing time spent on administrative tasks, ultimately delivering more precise forecasting and improved strategic planning capabilities.
Customer segmentation plays a foundational role in marketing KPI dashboard development by enabling targeted metric tracking, personalized campaign measurement, and audience-specific performance analysis across distinct customer groups. Through strategic segmentation, organizations can monitor conversion rates, engagement levels, and ROI for different demographics, behavioral patterns, and purchase histories, ultimately delivering more precise marketing insights and enhanced campaign effectiveness.
A/B testing results integrate into CRM marketing pipeline KPIs by tracking conversion rate variations, engagement metrics, campaign performance data, and customer journey optimization across different test segments. These insights enhance pipeline forecasting by identifying high-performing content variations, optimizing lead scoring models, and improving conversion predictions, with many marketing teams finding that systematic A/B integration delivers more accurate pipeline metrics and strategic campaign decisions.
Real-time data in CRM dashboards enables marketing teams to monitor campaign performance, track lead progression, and adjust strategies instantly based on current market conditions and customer behaviors. This immediate visibility allows teams to optimize budget allocation, prevent missed opportunities, and respond to trending patterns quickly, with many organizations finding that real-time insights significantly improve conversion rates and campaign ROI.
Businesses should tailor KPI dashboards by incorporating industry-specific metrics, regulatory compliance requirements, customer journey stages, and sector-relevant benchmarks that align with their operational priorities. Financial services might emphasize lead conversion rates and compliance tracking, while retail focuses on seasonal sales patterns and inventory turnover, with customized visualizations ultimately delivering targeted insights that enhance strategic decision-making and competitive advantage.
Organizations face challenges including data integration complexities, selecting relevant KPIs from numerous options, ensuring real-time accuracy, and aligning dashboard metrics with strategic objectives. These implementation hurdles often involve synchronizing multiple data sources, training teams on new systems, and maintaining data quality, with many companies finding that proper planning and stakeholder alignment ultimately delivers enhanced visibility and improved marketing performance.
Historical data influences future KPI targets by revealing performance trends, seasonal patterns, conversion rate fluctuations, and campaign effectiveness metrics that enable realistic goal setting. Through analysis of past lead generation cycles, customer acquisition costs, and pipeline velocity, marketing teams can establish data-driven benchmarks, identify growth opportunities, and set achievable targets that reflect market conditions, ultimately delivering more accurate forecasting and strategic resource allocation.
**INPUT**: What strategies can be employed to ensure stakeholder buy-in for KPI metrics presented in a dashboard? **OUTPUT**: Effective stakeholder buy-in strategies include collaborative metric selection, clear ROI demonstrations, customized dashboard views, regular performance reviews, and transparent data storytelling that connects metrics to business outcomes. These approaches streamline adoption by involving stakeholders in defining success criteria, showcasing tangible benefits like improved conversion rates and faster decision-making, ultimately delivering enhanced accountability and strategic alignment across teams.
Customer feedback and engagement metrics transform CRM dashboards from basic transaction tracking into comprehensive customer intelligence platforms, providing context around satisfaction scores, interaction frequency, response rates, and sentiment analysis. These metrics enable businesses to identify at-risk customers, optimize touchpoint strategies, and personalize campaigns more effectively, ultimately delivering improved retention rates and higher customer lifetime value.
Common pitfalls include overloading dashboards with excessive metrics, failing to align KPIs with business objectives, using outdated or inaccurate data sources, and creating complex visualizations that confuse rather than clarify insights. These design mistakes often result in decision-makers struggling to identify actionable trends, with many organizations finding that streamlined dashboards focusing on conversion rates, lead quality scores, and pipeline velocity deliver significantly better strategic outcomes.
-
They guys always go the extra mile to meet the expectations of their customers. Almost a year has been associated with them.
-
Great designs, really helpful.