


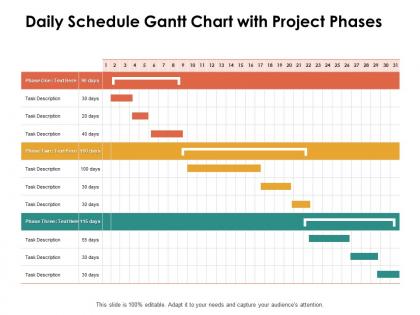
Daily schedule gantt chart with project phases ppt powerpoint presentation templates




Try Before you Buy Download Free Sample Product
 Impress Your
 Audience
 100%
100% Editable
 Save Hours
 of Time


Indulge in all the fun and frolic with our Daily Schedule Gantt Chart With Project Phases Ppt Powerpoint Presentation Templates. Get involved in the high jinks.
People who downloaded this PowerPoint presentation also viewed the following :
Daily schedule gantt chart with project phases ppt powerpoint presentation templates with all 2 slides:
Buck up their courage with our Daily Schedule Gantt Chart With Project Phases Ppt Powerpoint Presentation Templates. Give them an adrenaline injection.
FAQs for Daily schedule gantt chart with project phases ppt
Key components of an effective Gantt chart include task lists, timelines, dependencies, milestones, resource allocation, and progress tracking features. These elements work together by providing visual project oversight, enabling timeline management, and facilitating resource coordination, with many project managers finding that well-structured Gantt charts ultimately deliver improved project delivery and enhanced team accountability.
Gantt charts enhance project management efficiency by providing visual timeline clarity, enabling resource optimization, facilitating dependency tracking, and streamlining team coordination across complex workflows. Through integrated scheduling tools, project managers can identify bottlenecks earlier, allocate resources more strategically, and maintain stakeholder alignment, ultimately delivering projects faster while reducing costs and miscommunication risks.
Microsoft Project, Asana, Trello, Monday.com, and Smartsheet are the most commonly used Gantt chart software tools, offering varying levels of complexity and integration capabilities. These platforms streamline project planning by enabling real-time collaboration, automated scheduling, and resource allocation, with many organizations finding that cloud-based solutions like Asana and Monday.com deliver enhanced accessibility and team coordination.
Gantt charts facilitate team collaboration by providing shared project visibility, enabling coordinated task dependencies, streamlining communication through visual progress tracking, and establishing clear accountability with assigned responsibilities and deadlines. These visual tools enhance transparency across departments, reduce scheduling conflicts, and improve resource coordination, with many project teams finding that centralized timeline management ultimately delivers better alignment and fewer miscommunications.
Customizing Gantt charts involves adjusting timelines, task dependencies, resource allocation, milestone markers, and visual formatting to match project requirements. Manufacturing projects might emphasize production phases and quality checkpoints, while software development focuses on sprint cycles and testing phases, with many organizations finding that tailored charts enhance team coordination and stakeholder communication significantly.
Common Gantt chart pitfalls include overcomplicating timelines, failing to update progress regularly, unrealistic deadline setting, neglecting resource constraints, and poor task dependency mapping. These planning oversights can derail project momentum, with many organizations finding that streamlined charts focusing on critical milestones, realistic timeframes, and consistent updates ultimately deliver better team coordination and project success rates.
Gantt charts integrate with Agile methodologies by visualizing sprint timelines, tracking user story progress, and displaying release schedules across multiple iterations. While traditional Gantt charts focus on fixed deadlines, Agile-adapted versions emphasize iterative delivery and flexible scheduling, with many software development teams finding that hybrid approaches enhance stakeholder communication while maintaining Agile's adaptive flexibility.
Task dependencies in Gantt charts establish logical relationships between activities, showing which tasks must be completed before others can begin, ensuring proper project sequencing and resource allocation. These dependencies enable project managers to identify critical paths, anticipate bottlenecks, and automatically adjust timelines when delays occur, ultimately delivering more accurate scheduling and enhanced project control across complex initiatives.
Gantt charts help track project progress by providing visual timelines, milestone markers, task dependencies, completion percentages, and real-time status updates. Through color-coded progress bars and deadline indicators, project managers can quickly identify delays, resource bottlenecks, and critical path adjustments, ultimately enabling proactive decision-making and enhanced team coordination across complex initiatives.
**INPUT**: What strategies can be employed to present Gantt charts effectively in a presentation? **OUTPUT**: Effective Gantt chart presentation strategies include simplifying complex timelines, highlighting critical path dependencies, using color coding for different teams, focusing on key milestones, and providing clear task ownership visibility. These approaches streamline project communication by enhancing stakeholder understanding, reducing meeting time, and enabling faster decision-making, with many project managers finding that visual clarity ultimately delivers improved team alignment and accelerated project outcomes.
Gantt charts adapt through dynamic timeline adjustments, task resequencing, resource reallocation, milestone updates, and dependency modifications as projects encounter changes or delays. Through modern project management software, teams streamline schedule revisions, communicate impacts to stakeholders, and maintain project visibility, while enabling real-time collaboration and ultimately delivering enhanced operational efficiency despite evolving project requirements.
Gantt charts enable project managers to derive critical metrics including schedule variance, task completion rates, resource utilization levels, milestone adherence, and critical path performance indicators. These metrics streamline project monitoring by identifying bottlenecks, tracking progress against baselines, and measuring team productivity, with many organizations finding that regular Gantt analysis delivers improved deadline compliance and enhanced operational efficiency.
Gantt charts assist in resource allocation by visualizing task dependencies, timeline overlaps, and workload distribution across team members, enabling managers to identify potential bottlenecks and optimize resource deployment. Through clear timeline mapping, organizations can balance workloads, prevent resource conflicts, and ensure efficient utilization, with many project managers finding that strategic resource allocation ultimately delivers faster project completion and reduced operational costs.
Color coding and visual cues in Gantt charts enhance project clarity by distinguishing task types, priority levels, completion status, resource assignments, and critical path activities. These visual elements streamline project management by enabling quick status assessment, improving team communication, and facilitating faster decision-making, with many project managers finding that strategic color schemes ultimately deliver better oversight and more efficient resource allocation across complex initiatives.
Gantt charts can be adapted for remote teams through cloud-based platforms, real-time collaboration features, automated progress tracking, and integrated communication tools. These digital solutions enable distributed teams to maintain project visibility, coordinate across time zones, and streamline workflow management, with many organizations finding enhanced accountability and faster project delivery.
No Reviews