


Dashboard For Our Successful Digital Twin Model Process Digital Twin




Try Before you Buy Download Free Sample Product
 Impress Your
 Audience
 100%
100% Editable
 Save Hours
 of Time


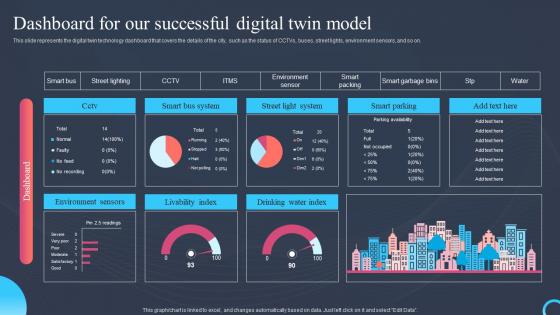
This slide represents the digital twin technology dashboard that covers the details of the city, such as the status of CCTVs, buses, street lights, environment sensors, and so on.
People who downloaded this PowerPoint presentation also viewed the following :
Dashboard For Our Successful Digital Twin Model Process Digital Twin with all 7 slides:
Use our Dashboard For Our Successful Digital Twin Model Process Digital Twin to effectively help you save your valuable time. They are readymade to fit into any presentation structure.






FAQs for Dashboard For Our Successful Digital Twin Model
A Digital Twin Dashboard is a real-time visualization interface that displays data from digital replicas of physical assets, systems, or processes. It functions across industries by providing centralized monitoring and analytics, with manufacturing plants tracking equipment performance, hospitals monitoring patient flow, and retail operations optimizing supply chains, ultimately delivering enhanced operational efficiency and predictive maintenance capabilities.
Digital Twin Dashboards integrate with IoT devices through APIs, cloud platforms, and real-time data streaming protocols, creating seamless connections between physical sensors and virtual models. These systems automatically collect, process, and visualize sensor data from manufacturing equipment, smart buildings, and supply chain assets, enabling organizations to monitor performance, predict maintenance needs, and optimize operations with unprecedented accuracy and speed.
Essential components of an effective Digital Twin Dashboard include real-time data visualization, predictive analytics modules, interactive 3D models, performance monitoring systems, and alert management features. These components streamline operational oversight by consolidating multiple data streams, enabling proactive maintenance decisions, and delivering comprehensive asset visibility, with many manufacturing and infrastructure organizations finding that integrated dashboards ultimately enhance efficiency and reduce operational costs.
Digital Twin Dashboards enhance operational efficiency by providing real-time visibility into physical assets, enabling predictive maintenance scheduling, and streamlining resource allocation across operations. Through integrated sensors and analytics, manufacturers, energy companies, and logistics firms can minimize downtime, optimize performance metrics, and accelerate decision-making processes, ultimately delivering cost reductions and competitive advantage.
Data analytics serves as the engine that transforms raw digital twin data into actionable insights, enabling predictive maintenance, performance optimization, and real-time decision-making capabilities. Through advanced analytics algorithms, organizations streamline operations by identifying patterns, predicting failures, and optimizing resource allocation, with manufacturing plants and smart cities finding that data-driven dashboards deliver enhanced efficiency and competitive advantage.
Digital Twin Dashboards enhance predictive maintenance by integrating real-time sensor data, historical performance patterns, and advanced analytics to predict equipment failures before they occur. Through continuous monitoring and machine learning algorithms, manufacturers in automotive, aerospace, and heavy machinery sectors can reduce unplanned downtime by 30-50%, optimize maintenance schedules, and significantly lower operational costs while extending asset lifecycles.
Key metrics for a Digital Twin Dashboard in asset management include real-time performance indicators, predictive maintenance alerts, energy consumption data, operational efficiency scores, and asset health status. These metrics enable organizations to monitor equipment condition, optimize resource allocation, and prevent costly downtime, with manufacturing facilities and energy companies finding that comprehensive dashboards deliver faster decision-making and significantly reduced maintenance costs.
Digital Twin Dashboards facilitate smart city decision-making by providing real-time visualization of urban systems, predictive analytics for infrastructure planning, and integrated data from transportation, utilities, and environmental sensors. Through interactive simulations, city planners can test scenarios like traffic flow optimization and energy distribution, ultimately enabling data-driven urban development that enhances citizen services while reducing operational costs.
Organizations face challenges including data integration complexity, high implementation costs, skills gaps, legacy system compatibility issues, and real-time synchronization difficulties when implementing Digital Twin Dashboards. While these obstacles require significant planning and investment, many manufacturers and smart city initiatives find that strategic phased rollouts, comprehensive training programs, and cloud-based solutions ultimately streamline operations and deliver substantial competitive advantages.
Digital Twin Dashboards enhance product development by providing real-time performance monitoring, predictive maintenance insights, design optimization feedback, and comprehensive lifecycle analytics. Through continuous data integration from physical products, manufacturers can accelerate innovation cycles, reduce development costs, and improve product reliability, while automotive and aerospace companies increasingly leverage these dashboards to streamline testing processes and enhance customer experiences.
Customization and user interface design significantly impact Digital Twin Dashboard effectiveness by enabling role-specific data views, intuitive navigation, and actionable insights tailored to individual user needs. Well-designed interfaces streamline decision-making processes across manufacturing, healthcare, and smart city applications, with many organizations finding that personalized dashboards reduce response times and enhance operational efficiency through improved data accessibility.
Best practices for Digital Twin Dashboard security include end-to-end encryption, multi-factor authentication, role-based access controls, regular security audits, and data anonymization techniques. These measures work together by protecting sensitive operational data, ensuring compliance with privacy regulations, and maintaining system integrity, with many manufacturing and healthcare organizations finding that robust security frameworks ultimately enable confident data sharing while delivering competitive advantages through enhanced trust and regulatory compliance.
Healthcare industries can significantly benefit from Digital Twin Dashboards by enabling real-time patient monitoring, optimizing resource allocation, and enhancing predictive care delivery. These systems streamline hospital operations through equipment maintenance tracking, patient flow optimization, and treatment outcome analysis, with many healthcare organizations finding that integrated dashboards ultimately deliver faster patient services, reduced operational costs, and improved care experiences.
Digital twin dashboards will increasingly integrate predictive analytics, autonomous optimization, real-time AI decision-making, and advanced machine learning algorithms for pattern recognition. Through enhanced AI capabilities, organizations across manufacturing, healthcare, and smart cities can anticipate equipment failures, optimize resource allocation, and automate complex processes, ultimately delivering proactive maintenance strategies and significantly improved operational efficiency.
Digital Twin Dashboards contribute to sustainability by enabling real-time monitoring of energy consumption, waste generation, and resource utilization across operations, while identifying optimization opportunities through predictive analytics and scenario modeling. Through comprehensive visualization of environmental metrics, organizations streamline resource allocation, minimize operational waste, and enhance energy efficiency, ultimately delivering measurable carbon footprint reductions and cost savings.
-
I want to thank SlideTeam for the work that they do, especially their customer service.
-
Great product with effective design. Helped a lot in our corporate presentations. Easy to edit and stunning visuals.