


Dashboard Of Data Analytics In Digital Marketing




Try Before you Buy Download Free Sample Product
 Impress Your
 Audience
 100%
100% Editable
 Save Hours
 of Time


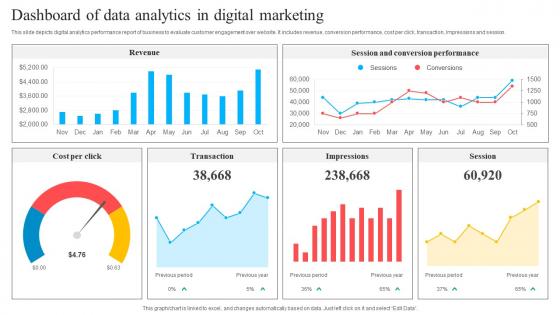
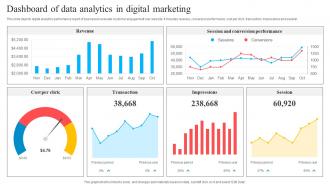
This slide depicts digital analytics performance report of business to evaluate customer engagement over website. It includes revenue, conversion performance, cost per click, transaction, Impressions and session.
People who downloaded this PowerPoint presentation also viewed the following :
Dashboard Of Data Analytics In Digital Marketing with all 9 slides:
Use our Dashboard Of Data Analytics In Digital Marketing to effectively help you save your valuable time. They are readymade to fit into any presentation structure.








FAQs for Dashboard Of Data Analytics
Effective dashboard components include clear data hierarchy, intuitive navigation, real-time metrics, interactive filters, and responsive design elements. These features streamline decision-making by presenting complex information through clean visualizations, customizable views, and actionable insights, with many organizations finding that well-designed dashboards ultimately enhance operational efficiency and accelerate strategic responses.
Organizations determine relevant dashboard metrics by aligning measurements with strategic objectives, stakeholder needs, and key performance indicators that directly impact business outcomes. Through audience analysis, goal mapping, and iterative feedback collection, companies across sectors like retail, healthcare, and finance streamline decision-making processes, enhance operational visibility, and ultimately deliver more targeted insights that drive competitive advantage.
User experience plays a crucial role in dashboard analytics design by ensuring data visualization is intuitive, accessible, and actionable for decision-makers across organizational levels. Effective UX design streamlines information consumption, minimizes cognitive load, and enhances user adoption, with many organizations finding that well-designed dashboards significantly improve data-driven decision-making speed and accuracy.
Real-time data integration enhances dashboard analytics by providing immediate insights, enabling faster decision-making, and eliminating data lag that can compromise strategic responses. Through continuous data streaming, organizations can monitor performance metrics, detect anomalies instantly, and respond to market changes proactively, ultimately delivering competitive advantage and improved operational efficiency.
Common dashboard mistakes include overcrowding with excessive metrics, poor visual hierarchy, irrelevant data inclusion, inconsistent design elements, and lack of user-focused objectives. These pitfalls undermine decision-making effectiveness by creating confusion rather than clarity, with many organizations finding that streamlined, purpose-driven dashboards significantly enhance operational efficiency and strategic insights.
Dashboard analytics support decision-making by providing real-time data visualization, centralized performance metrics, trend identification, predictive insights, and automated reporting capabilities. Through interactive dashboards, organizations streamline data interpretation, enhance strategic planning, and accelerate response times, with many financial services and retail companies finding that comprehensive analytics ultimately deliver improved operational efficiency and competitive advantage.
**INPUT**: What tools or software are best suited for building interactive dashboards? **OUTPUT**: Leading interactive dashboard tools include Tableau, Power BI, Qlik Sense, Google Data Studio, and Looker, each offering distinct visualization capabilities and integration options. These platforms streamline data analysis by enabling real-time updates, drag-and-drop functionality, and seamless database connectivity, with many organizations finding that strategic tool selection ultimately delivers enhanced decision-making speed and operational efficiency. [Word count: 58 words]
Industries customize dashboards by integrating sector-specific KPIs, regulatory requirements, and operational workflows tailored to their unique business environments. Healthcare organizations focus on patient outcomes and compliance metrics, while retail companies prioritize inventory turnover and customer behavior analytics, and financial institutions emphasize risk management dashboards, ultimately delivering targeted insights that drive industry-specific competitive advantages.
Data storytelling within dashboard analytics transforms raw metrics into compelling narratives that drive strategic decision-making, enhance stakeholder engagement, and facilitate cross-functional understanding of complex business insights. Through visual narratives and contextual frameworks, organizations streamline communication processes, accelerate decision cycles, and ultimately deliver improved operational efficiency, with many enterprises finding that storytelling-driven dashboards significantly enhance executive buy-in and strategic alignment.
Dashboards can be tailored through customized data granularity, visualization complexity, and strategic focus, with executive dashboards emphasizing high-level KPIs and trend analysis while operational dashboards feature detailed metrics and real-time performance indicators. Organizations across industries streamline decision-making by delivering role-specific insights, actionable data depth, and targeted reporting hierarchies, ultimately enhancing both strategic oversight and operational efficiency.
Cloud-based dashboard solutions offer scalability, real-time collaboration, cost-effectiveness, automatic updates, and enhanced accessibility across devices and locations. While these platforms deliver significant operational efficiency and streamlined data sharing, organizations must consider data security protocols and internet dependency, with many financial services and retail companies finding that strategic cloud migration ultimately enhances competitive advantage through faster decision-making capabilities.
Dashboards become accessible for remote teams through cloud-based platforms, mobile optimization, real-time collaboration features, and intuitive user interfaces that require minimal training. These technologies streamline remote decision-making by enabling instant data sharing, synchronized updates, and cross-device functionality, with many distributed organizations finding that centralized analytics dashboards ultimately deliver faster insights and improved team coordination across locations.
Techniques for ensuring dashboard data accuracy include automated data validation, real-time monitoring systems, source system integration checks, scheduled data quality audits, and establishing clear data governance protocols. These methods streamline verification processes by detecting anomalies early, maintaining consistent data lineage, and implementing error correction workflows, with many organizations finding that proactive monitoring ultimately delivers more reliable insights and faster decision-making capabilities.
Dashboard success evaluation involves measuring user adoption rates, tracking key performance indicator improvements, analyzing decision-making speed, and assessing data accuracy and accessibility. Through user feedback surveys and performance metrics, organizations in sectors like retail and healthcare find that effective dashboards reduce reporting time by 60-70%, enhance operational visibility, and ultimately deliver faster strategic decisions with improved business outcomes.
Emerging trends transforming dashboard analytics include real-time streaming data integration, AI-powered predictive visualizations, interactive voice commands, augmented reality overlays, and automated insight generation. These technologies enhance decision-making by delivering instant data updates, predictive forecasting capabilities, and intuitive user interactions, with many organizations finding that modern dashboards significantly streamline operational efficiency and strategic planning processes.
-
Amazing variety of PowerPoint slides. Really helpful in designing professional presentations.
-
I have been using SlideTeam for the past six months. Very happy and satisfied!