


Dashboard To Track Resolved Incidents Service Desk Incident Management




Try Before you Buy Download Free Sample Product
 Impress Your
 Audience
 100%
100% Editable
 Save Hours
 of Time


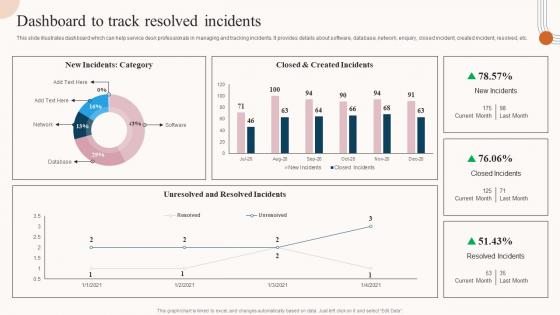
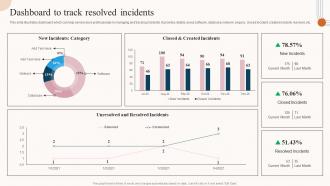
This slide illustrates dashboard which can help service desk professionals in managing and tracking incidents. It provides details about software, database, network, enquiry, closed incident, created incident, resolved, etc.
People who downloaded this PowerPoint presentation also viewed the following :
Dashboard To Track Resolved Incidents Service Desk Incident Management with all 7 slides:
Use our Dashboard To Track Resolved Incidents Service Desk Incident Management to effectively help you save your valuable time. They are readymade to fit into any presentation structure.





FAQs for Dashboard To Track Resolved Incidents Service
**INPUT**: What key metrics should be displayed on a Service Desk Dashboard for effective performance monitoring? **OUTPUT**: Key Service Desk Dashboard metrics include ticket volume, resolution times, first-call resolution rates, customer satisfaction scores, and agent productivity measures. These metrics enable organizations to streamline operations, identify bottlenecks, and enhance service quality, with many IT departments finding that comprehensive dashboards ultimately deliver faster incident response and improved customer experiences. [Word count: 53 words]
A Service Desk Dashboard improves response times by providing real-time visibility into ticket volumes, priority levels, agent workloads, and performance metrics, enabling managers to allocate resources efficiently and identify bottlenecks quickly. Through automated escalation workflows and comprehensive analytics, organizations streamline issue resolution, reduce average handling times, and enhance customer experiences, with many finding that proactive monitoring ultimately delivers faster service delivery and increased satisfaction rates.
Common challenges in designing Service Desk Dashboard include balancing comprehensive data with visual clarity, ensuring real-time accuracy, managing stakeholder expectations across different roles, and integrating multiple data sources seamlessly. These obstacles can be overcome through user-centric design approaches, automated data validation systems, and iterative feedback processes, with many organizations finding that phased implementations and clear metric prioritization ultimately deliver enhanced operational visibility and faster incident resolution.
**INPUT**: Which visualization tools are most effective for creating an engaging Service Desk Dashboard? **OUTPUT**: Effective Service Desk Dashboard visualization tools include Tableau, Power BI, Grafana, ServiceNow dashboards, and Splunk, each offering real-time monitoring capabilities and customizable interfaces. These platforms streamline incident tracking, enhance response time visibility, and automate reporting workflows, with many IT organizations finding that strategic dashboard implementation delivers improved service transparency and operational efficiency. **Word count: 55 words**
Real-time data integration enhances Service Desk Dashboard functionality by providing instant incident visibility, automated ticket routing, and immediate performance metrics tracking. Through live data feeds, IT teams streamline response times, optimize resource allocation, and deliver proactive service management, with many organizations finding that real-time integration ultimately reduces resolution times and improves customer satisfaction significantly.
Automation streamlines Service Desk Dashboard data collection by automatically gathering incident reports, performance metrics, user feedback, and system alerts from multiple sources without manual intervention. Through integrated APIs and monitoring tools, organizations eliminate data entry errors, ensure real-time updates, and reduce administrative overhead, ultimately delivering more accurate insights and faster response times.
KPIs can be tailored by aligning metrics with each team's core responsibilities, workload patterns, and performance objectives within the broader service delivery framework. Technical support teams focus on resolution times and escalation rates, while customer service teams prioritize satisfaction scores and first-contact resolution, ultimately enabling targeted performance improvements and strategic resource allocation across departments.
Analyzing historical data trends on a Service Desk Dashboard reveals incident patterns, peak usage periods, resolution timeframes, recurring issues, and team performance metrics. These insights enable organizations to optimize resource allocation, predict future demands, and identify root causes of persistent problems, with many IT departments finding that trend analysis ultimately reduces response times and enhances service quality.
Service Desk Dashboards should be updated in real-time or near real-time for operational metrics, with strategic reports refreshed daily or weekly depending on organizational needs. The frequency depends on your service environment's complexity, with high-volume organizations like financial services and healthcare requiring continuous updates to maintain operational efficiency and deliver responsive customer support.
Best practices for defining user roles and access levels include implementing role-based access control, establishing clear permission hierarchies, conducting regular access reviews, defining granular data visibility rules, and maintaining audit trails. These approaches streamline security management by preventing unauthorized access, ensuring data confidentiality, and enabling seamless workflow automation, with many IT organizations finding that structured role definitions significantly enhance operational efficiency while reducing compliance risks.
A Service Desk Dashboard facilitates better IT-business communication by providing real-time visibility into service requests, incident status, and resolution timelines through centralized reporting and automated notifications. This transparency enables business units to track their requests while allowing IT teams to proactively communicate delays or solutions, ultimately reducing friction and building trust across departments.
A well-designed Service Desk Dashboard significantly boosts team morale and productivity by providing clear visibility into performance metrics, ticket resolution rates, and workload distribution. These dashboards streamline operations by reducing response times, enhancing collaboration, and enabling proactive issue management, with many IT organizations finding that transparent performance tracking ultimately delivers improved job satisfaction and operational efficiency.
Customer feedback can be effectively incorporated through real-time satisfaction surveys, feedback widgets, sentiment analysis tools, automated ticket follow-ups, and integrated review systems. These mechanisms enable service teams to track satisfaction trends, identify recurring issues, and prioritize improvements, with many organizations finding that direct feedback integration enhances response times and ultimately delivers superior customer experiences.
Features that increase user engagement with Service Desk Dashboards include real-time ticket tracking, interactive visual analytics, personalized user portals, automated status notifications, and self-service knowledge bases. These capabilities streamline support experiences by reducing response times, enhancing transparency, and enabling proactive issue resolution, with many organizations finding that intuitive interfaces and mobile accessibility ultimately deliver improved user satisfaction and operational efficiency.
Mobile-friendly dashboards enhance Service Desk accessibility by providing real-time metrics through responsive interfaces, cross-device synchronization, and intuitive touch navigation optimized for smartphones and tablets. These technologies streamline remote operations by enabling instant incident tracking, performance monitoring, and team collaboration from any location, with many distributed organizations finding that mobile accessibility ultimately delivers faster response times and improved service quality.
-
The information is visually stunning and easy to understand, making it perfect for any business person. So I would highly recommend you purchase this PPT design now!
-
Kudos to SlideTeam for achieving the high success rate in delivering the top-notch slides.