


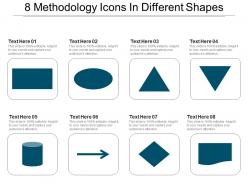
8 methodology icons in different shapes





Try Before you Buy Download Free Sample Product
 Impress Your
 Audience
 100%
100% Editable
 Save Hours
 of Time


Your thoughts are making a concerted effort. Our 8 Methodology Icons In Different Shapes will maintain focus.
People who downloaded this PowerPoint presentation also viewed the following :
8 methodology icons in different shapes with all 5 slides:
Bring in the joy with our 8 Methodology Icons In Different Shapes. Create an interesting interaction for all.
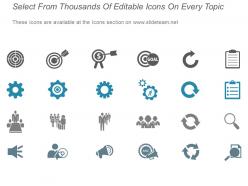
FAQs for 8 methodology icons
Methodology icons commonly used in presentation templates include process flows, cycle diagrams, funnel shapes, pyramid structures, and timeline arrows. These visual elements streamline complex methodologies by representing sequential steps, iterative processes, and hierarchical frameworks, with many organizations finding that strategic icon usage enhances audience comprehension and delivers more impactful presentations.
Methodology icons enhance understanding by providing visual anchors that simplify abstract processes, create memorable cognitive connections, and guide audiences through step-by-step frameworks with immediate clarity. These visual elements streamline complex methodologies like Six Sigma or design thinking by replacing dense text with intuitive symbols, ultimately delivering faster comprehension and improved retention across diverse learning styles.
When choosing icons to represent methodologies, consider visual clarity, conceptual relevance, scalability across platforms, cultural neutrality, and consistent styling within your design system. These principles ensure icons effectively communicate complex processes while maintaining professional appeal, with many organizations finding that simplified, metaphor-based designs enhance comprehension and user engagement across diverse audiences, ultimately delivering stronger visual communication and brand consistency.
Visual representations of methodologies significantly enhance audience engagement by transforming complex processes into digestible, memorable formats that reduce cognitive load and increase comprehension rates. These visual elements enable faster information processing, improve knowledge retention by up to 65%, and facilitate better decision-making across organizations, with many businesses finding that methodology icons streamline training programs and stakeholder communications.
Color choices significantly enhance methodology icon effectiveness by improving recognition, conveying meaning, creating visual hierarchy, establishing brand consistency, and guiding user attention through complex processes. Strategic color application enables organizations to streamline communication across teams, reduce cognitive load during presentations, and enhance comprehension rates, with many businesses finding that consistent color coding accelerates decision-making and project workflows.
Yes, industries often favor specific shapes and icons that align with their operational focus and cultural expectations. Technology companies frequently use geometric and digital-inspired icons, healthcare organizations prefer circular and flowing shapes suggesting continuity, while manufacturing and engineering sectors gravitate toward structured frameworks with angular, process-driven visuals that emphasize systematic approaches and operational efficiency.
Creating custom methodology icons involves defining brand elements like color palettes, typography styles, visual themes, and consistent design principles, then applying these across icon shapes, symbols, and layouts. Through design software like Adobe Illustrator or Canva, businesses streamline brand recognition, enhance presentation cohesiveness, and deliver professional visual consistency, with many organizations finding that custom iconography significantly strengthens their methodology presentations and stakeholder engagement.
**INPUT**: What tools or software are best suited for designing methodology icons? **OUTPUT**: Professional design software like Adobe Illustrator, Sketch, Figma, Canva Pro, and Iconify delivers optimal methodology icon creation through vector-based precision, extensive symbol libraries, and collaborative features. These platforms streamline icon development by offering scalable graphics, consistent styling templates, and team integration capabilities, with many organizations finding that cloud-based tools like Figma enhance workflow efficiency and brand consistency. [Word count: 58 words]
**INPUT**: What are some examples of successful presentations that effectively utilize methodology icons? **OUTPUT**: Successful presentations using methodology icons include McKinsey's problem-solving frameworks, Deloitte's digital transformation roadmaps, and pharmaceutical companies' clinical trial processes. These presentations streamline complex workflows through visual storytelling, enhance audience comprehension across technical teams, and accelerate decision-making timelines, with many organizations finding that structured icon-based methodologies improve stakeholder alignment and project outcomes.
Infographics with methodology icons enhance educational learning by simplifying complex processes, improving information retention through visual memory, and accommodating diverse learning styles simultaneously. These visual tools enable educators to present step-by-step methodologies more effectively, with many schools and universities finding that students grasp research methods, scientific processes, and analytical frameworks faster, ultimately delivering improved comprehension and academic outcomes.
Methodology icons simplify research communication by transforming complex processes into visual symbols, creating universal understanding through standardized representations, and eliminating technical jargon barriers that often confuse stakeholders. These visual tools enable researchers to present methodologies seamlessly across diverse audiences, with many organizations finding that icon-based presentations accelerate project approvals and enhance collaboration between technical teams and non-specialist decision-makers.
**Do's** include maintaining consistent style and size, using universally recognizable symbols, ensuring adequate contrast, and aligning icons with your brand colors and messaging hierarchy. **Don'ts** involve mixing different icon families, overcrowding slides with excessive symbols, using decorative icons without purpose, or selecting culturally ambiguous imagery, with many organizations finding that strategic icon usage enhances audience comprehension while reducing cognitive load.
Cultural differences significantly affect methodology icon interpretation through varying color meanings, directional reading patterns, religious symbolism, and geometric associations across different societies. For instance, while red signifies danger in Western cultures, it represents prosperity in many Asian contexts, and circular shapes may convey completeness in some cultures but endless cycles in others, ultimately requiring culturally-adaptive design strategies for global business applications.
Consistent iconography creates visual cohesion, enhances audience comprehension, establishes professional brand identity, and streamlines information processing throughout presentations. These visual elements enable viewers to quickly recognize patterns, retain key messages more effectively, and navigate complex content seamlessly, with many organizations finding that unified icon systems significantly improve presentation clarity and deliver stronger audience engagement across training materials, business proposals, and strategic communications.
Methodology icons effectively represent agile and iterative processes through visual symbols like sprint cycles, kanban boards, scrum frameworks, iteration loops, and continuous improvement arrows. These visual elements streamline complex project management concepts by illustrating workflow stages, team collaboration points, and feedback mechanisms, ultimately enabling stakeholders to quickly grasp project timelines and deliverables while enhancing presentation clarity.
-
Great product with highly impressive and engaging designs.
-
Easily Editable.