Developing new marketing technology stack powerpoint presentation slides
Identify multiple tools in the technology stack by employing Developing New Marketing Technology Stack PowerPoint Presentation Slides. The agenda of this presentation is to identify the customer journey and develop a complementing marketing technology stack. Our market automation PPT slideshow covers business performance highlights, current market channels, customer surveys and feedback, and possible statements. Display various marketing technology tools that the organization can utilize in order to develop their own strategy by taking the assistance of marketing automation PowerPoint infographics. Give an overview of current marketing channels that are used by the organization. You can also display various customer satisfaction metrics over the year such as net promoter score, churn rate, conversion rate, and retention rate. The problem statement section helps to display various issues that the organization has been facing due to the poor performance of the marketing technology stack. Thus download our topic-specific market technology stack PowerPoint presentation to maintain and optimize the marketing technology stack.
- Google Slides is a new FREE Presentation software from Google.
- All our content is 100% compatible with Google Slides.
- Just download our designs, and upload them to Google Slides and they will work automatically.
- Amaze your audience with SlideTeam and Google Slides.
-
Want Changes to This PPT Slide? Check out our Presentation Design Services
- WideScreen Aspect ratio is becoming a very popular format. When you download this product, the downloaded ZIP will contain this product in both standard and widescreen format.
-

- Some older products that we have may only be in standard format, but they can easily be converted to widescreen.
- To do this, please open the SlideTeam product in Powerpoint, and go to
- Design ( On the top bar) -> Page Setup -> and select "On-screen Show (16:9)” in the drop down for "Slides Sized for".
- The slide or theme will change to widescreen, and all graphics will adjust automatically. You can similarly convert our content to any other desired screen aspect ratio.
Compatible With Google Slides

Get This In WideScreen
You must be logged in to download this presentation.
PowerPoint presentation slides
This complete deck can be used to present to your team. It has PPT slides on various topics highlighting all the core areas of your business needs. This complete deck focuses on Developing New Marketing Technology Stack Powerpoint Presentation Slides and has professionally designed templates with suitable visuals and appropriate content. This deck consists of total of fourty six slides. All the slides are completely customizable for your convenience. You can change the colour, text and font size of these templates. You can add or delete the content if needed. Get access to this professionally designed complete presentation by clicking the download button below.
People who downloaded this PowerPoint presentation also viewed the following :
Content of this Powerpoint Presentation
Slide 1: This slide introduces Developing New Marketing Technology Stack. State your Company name and begin.
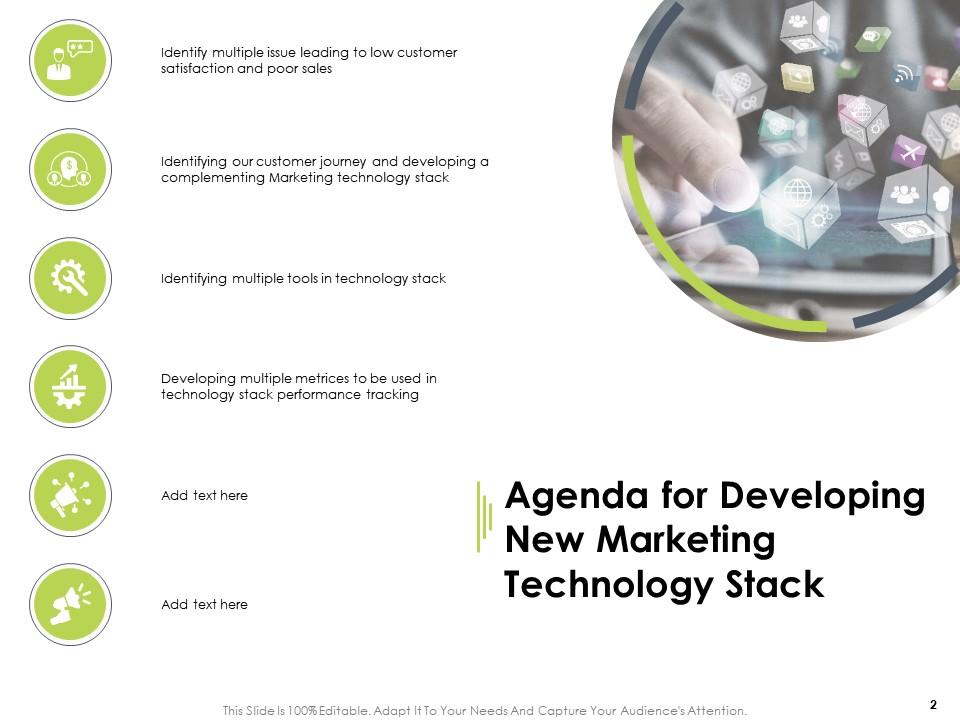
Slide 2: This slide displays Agenda for Developing New Marketing Technology Stack
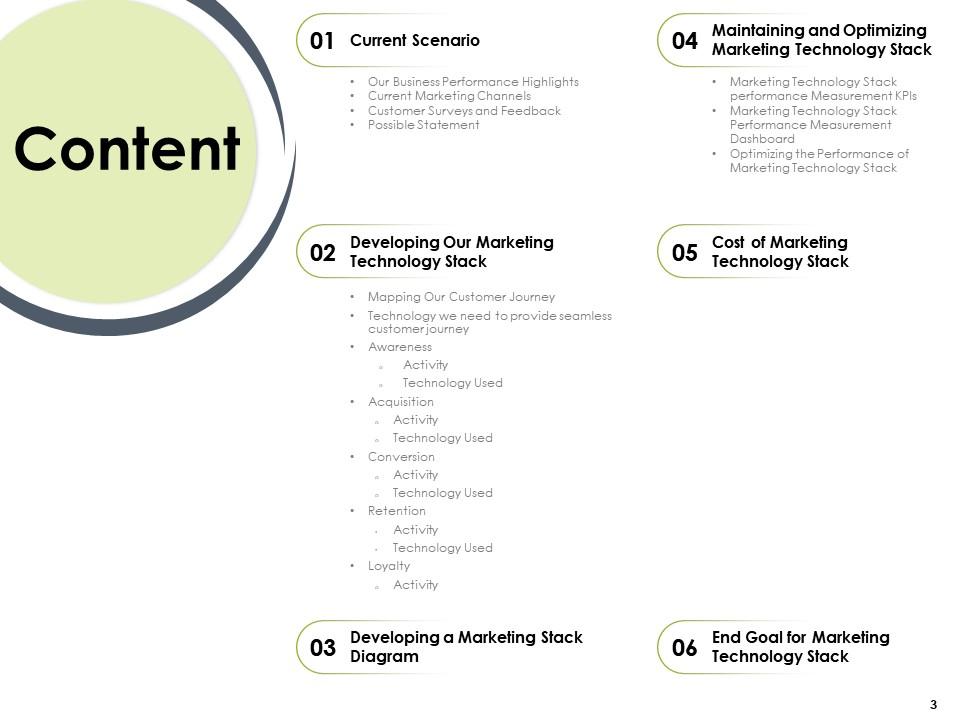
Slide 3: This slide displays Content.
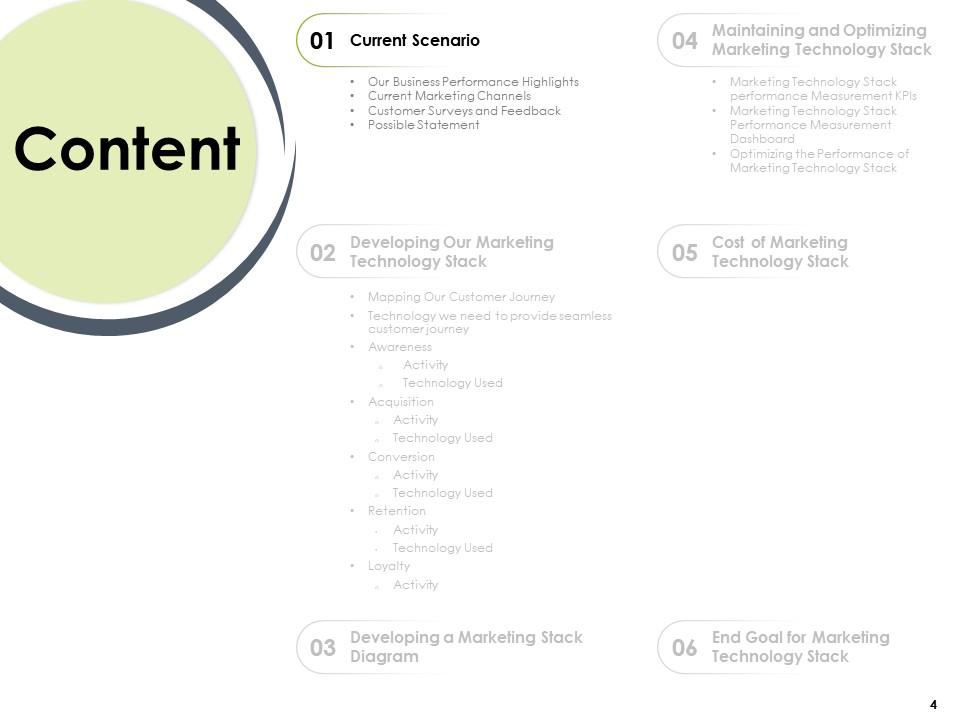
Slide 4: This slide displays Content of the presentation.
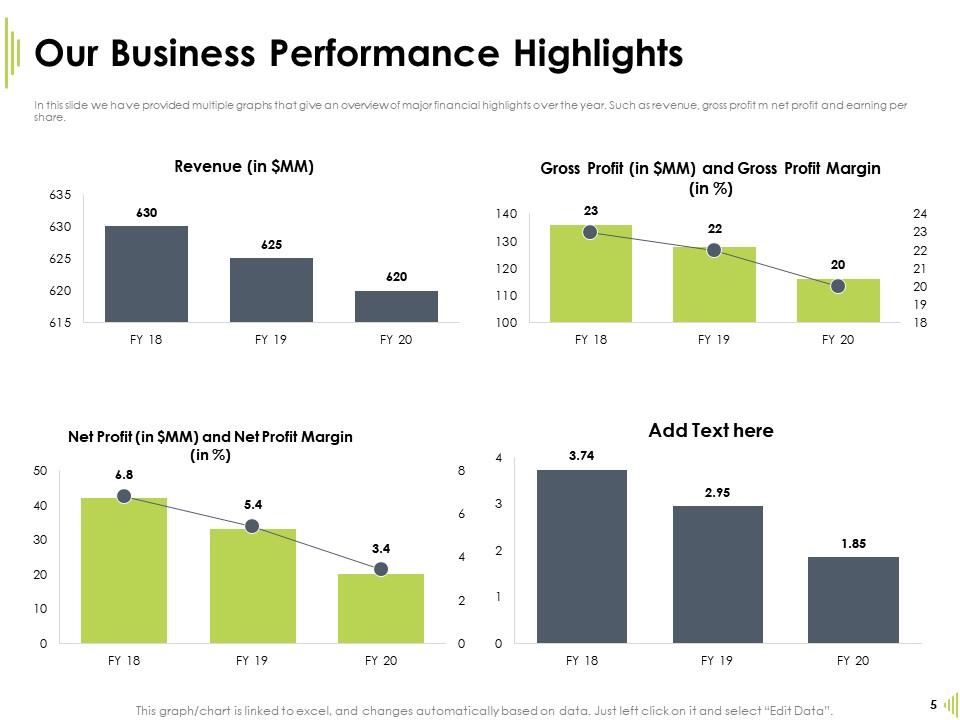
Slide 5: In This Slide We Have Provided Multiple Graphs That Give An Overview Of Major Financial Highlights Over The Year. Such As Revenue, Gross Profit M Net Profit And Earning Per Share.
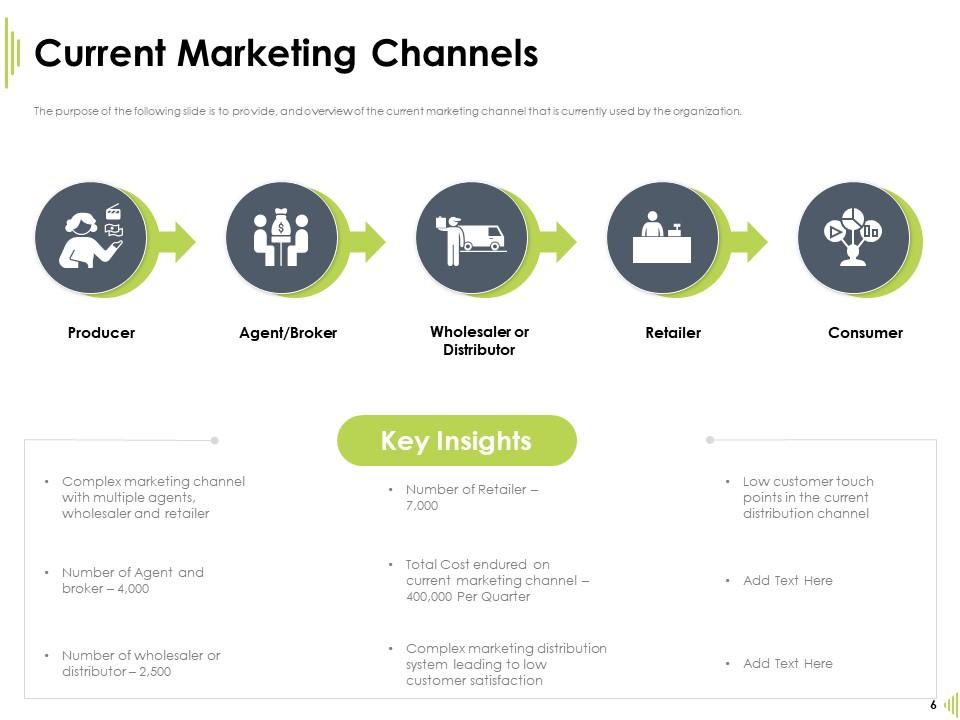
Slide 6: The purpose of the following slide is to provide, and overview of the current marketing channel that is currently used by the organization.
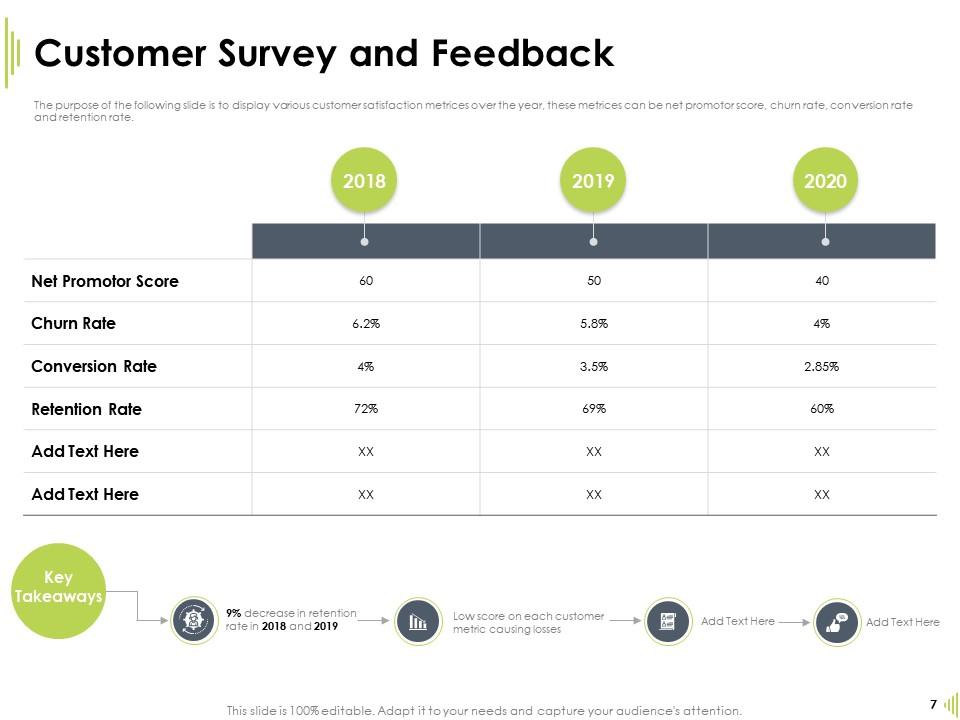
Slide 7: The purpose of the following slide is to display various customer satisfaction metrices over the year, these metrices can be net promotor score, churn rate, conversion rate and retention rate.
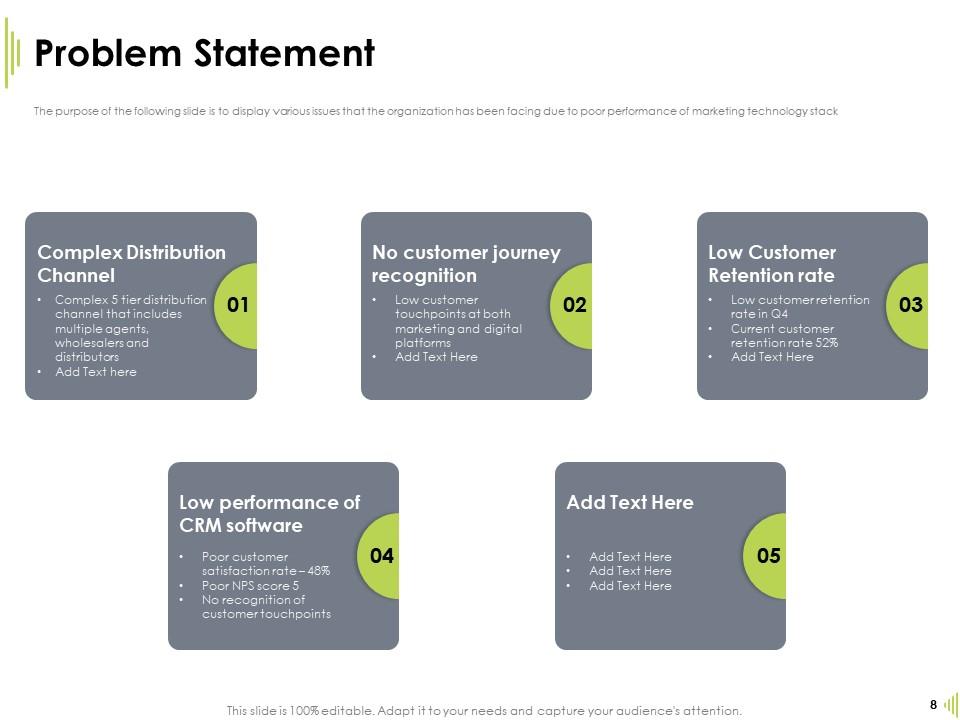
Slide 8: The purpose of the following slide is to display various issues that the organization has been facing due to poor performance of marketing technology stack
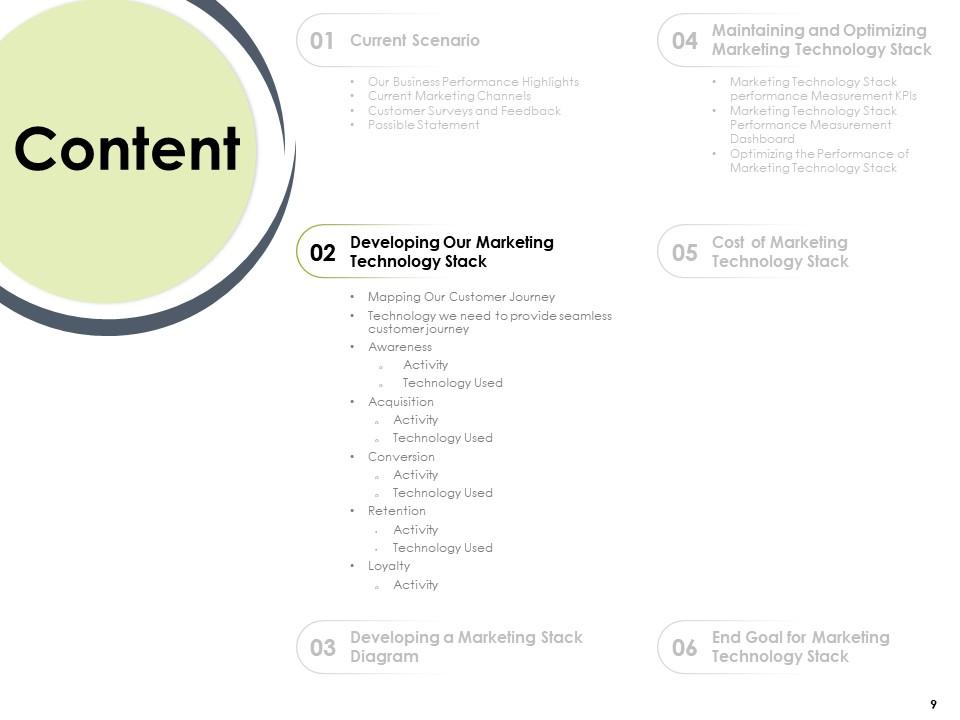
Slide 9: This slide displays Content.
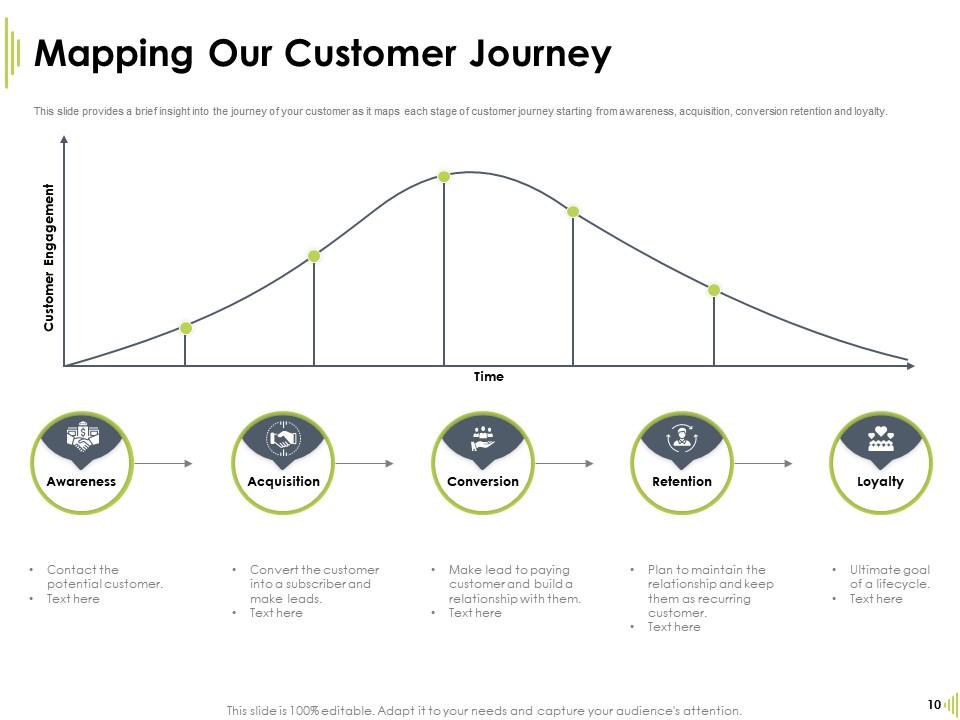
Slide 10: This slide provides a brief insight into the journey of your customer as it maps each stage of customer journey starting from awareness, acquisition, conversion retention and loyalty.
Slide 11: The purpose of the following slide is to display various marketing technology tool that the organization can utilize in order to develop their own marketing stack
Slide 12: This slide depicts Awareness.
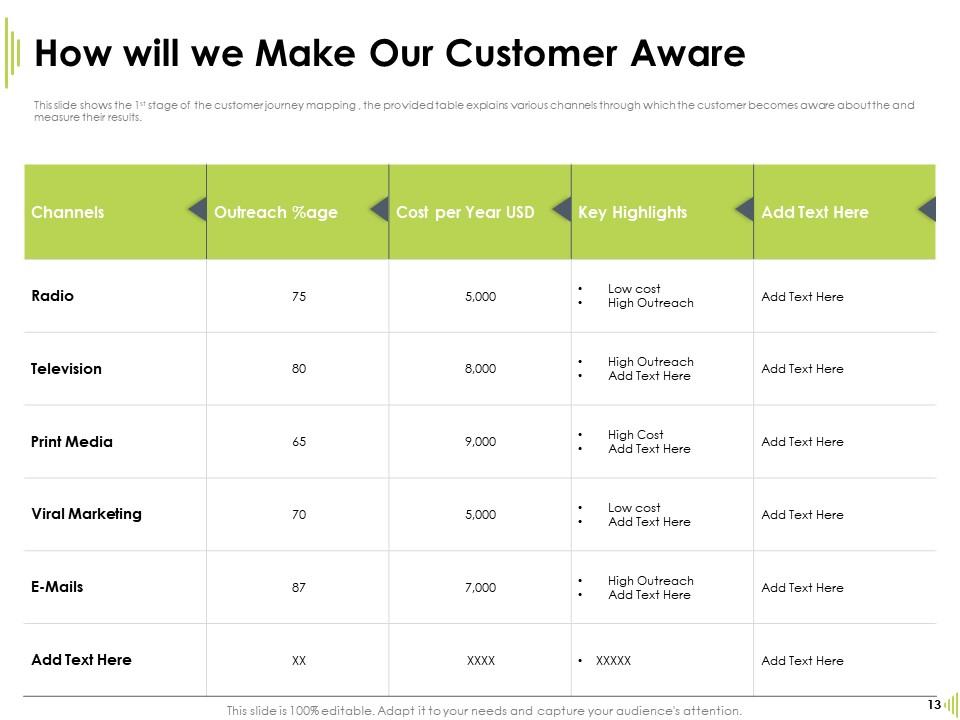
Slide 13: This slide shows the 1st stage of the customer journey mapping , the provided table explains various channels through which the customer becomes aware about the and measure their results.
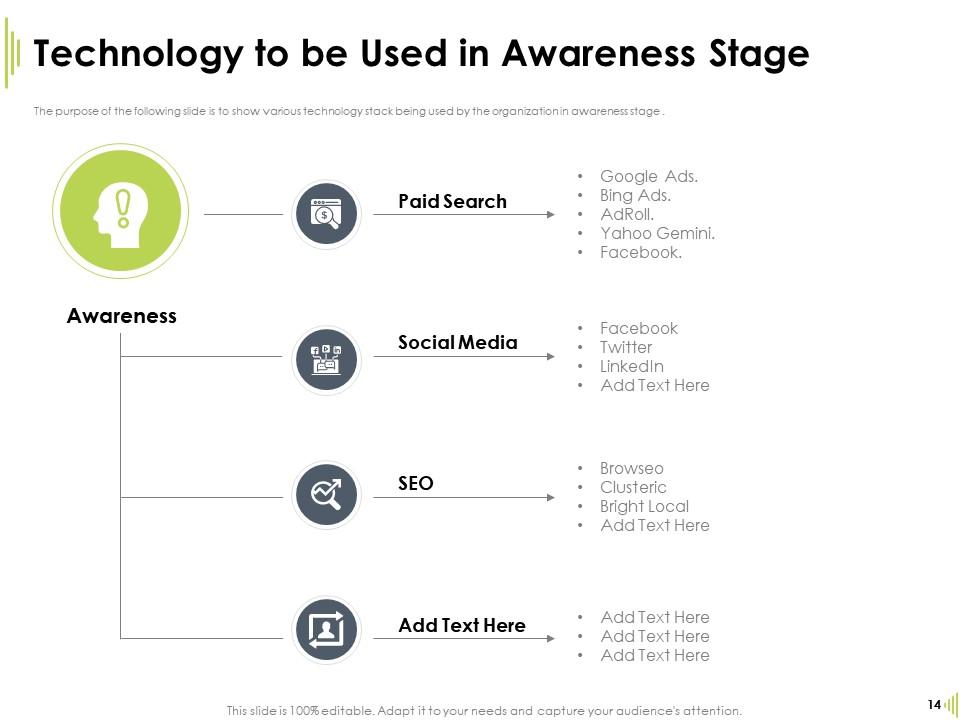
Slide 14: The purpose of the following slide is to show various technology stack being used by the organization in awareness stage .
Slide 15: This slide describes Acquisition.
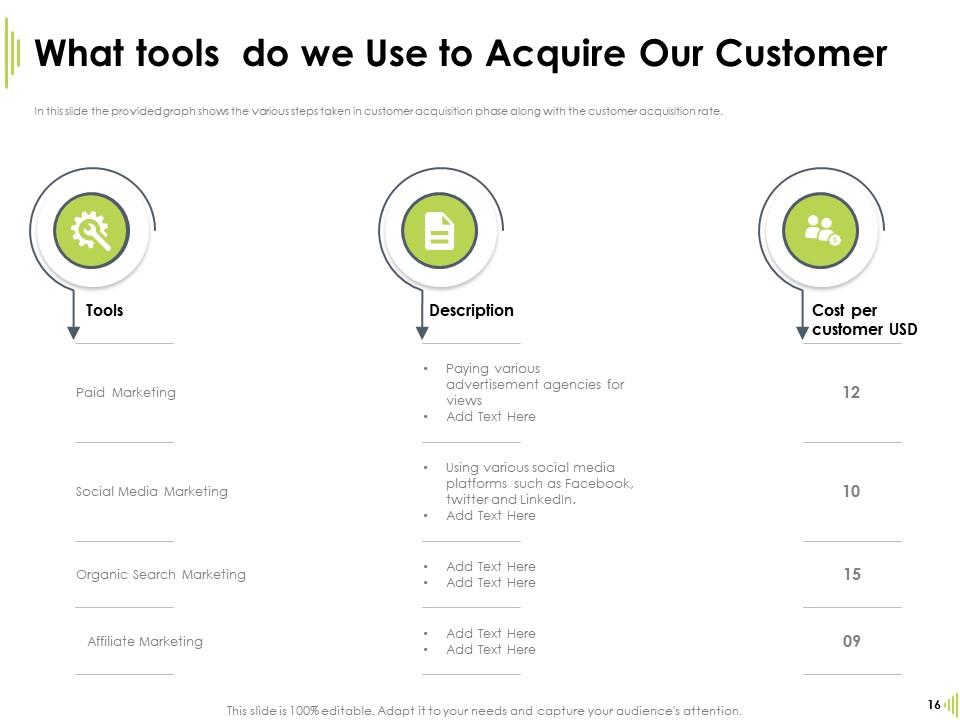
Slide 16: In this slide the provided graph shows the various steps taken in customer acquisition phase along with the customer acquisition rate.
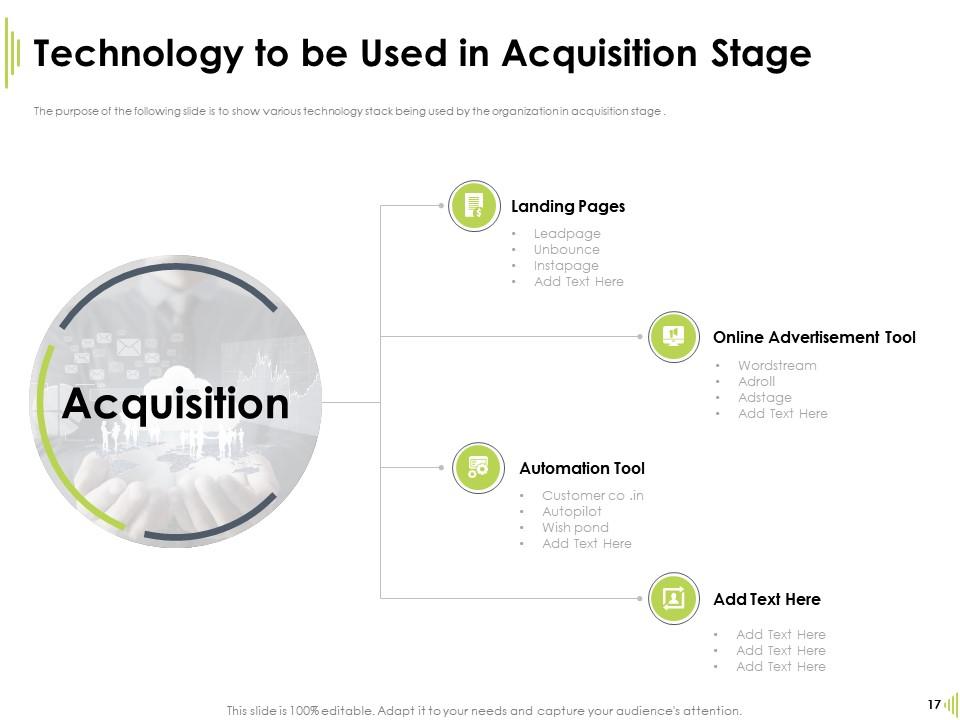
Slide 17: The purpose of the following slide is to show various technology stack being used by the organization in acquisition stage .
Slide 18: This slide displays Conversion.
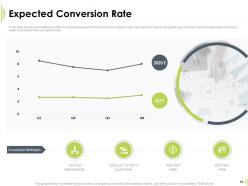
Slide 19: In this slide we have provided you with a comparative graph that shows the conversion rate over a span of 2 years along with key activities that the organization is doing in order to increase their conversion rate.
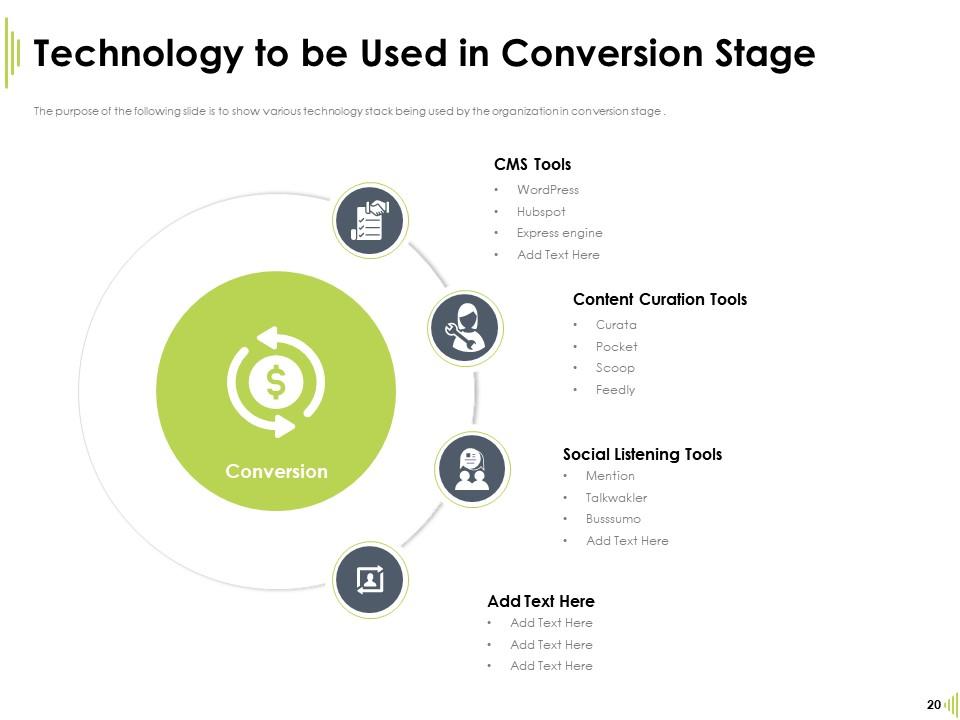
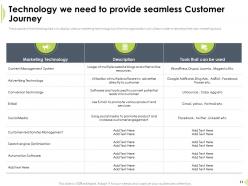
Slide 20: This slide showcases Technology to be Used in Conversion Stage
Slide 21: This slide depicts Retention.
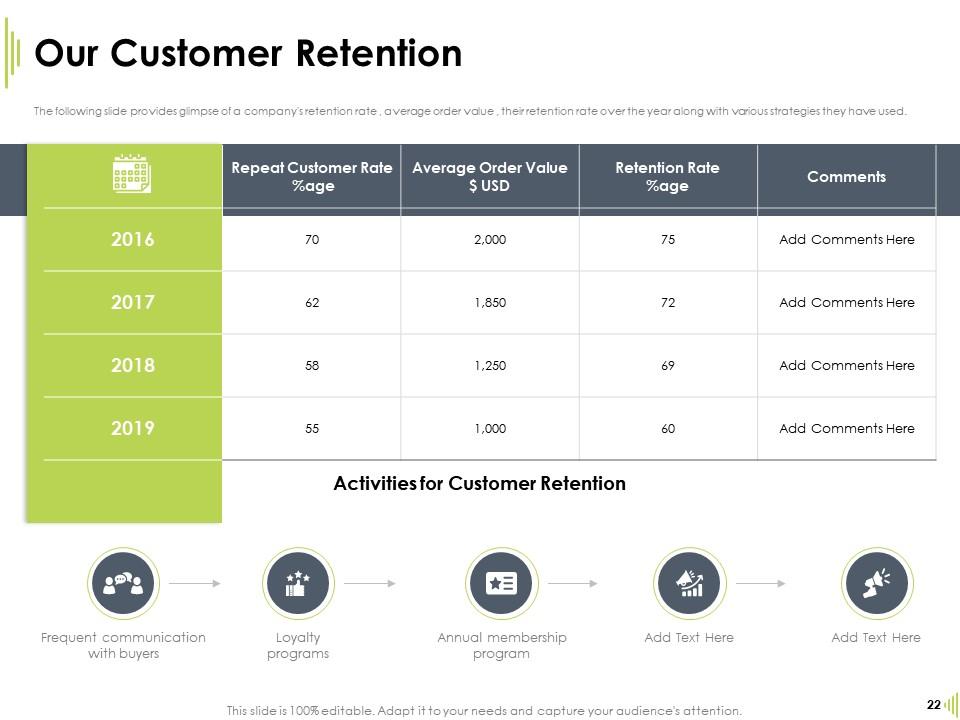
Slide 22: The following slide provides glimpse of a company's retention rate , average order value , their retention rate over the year along with various strategies they have used.
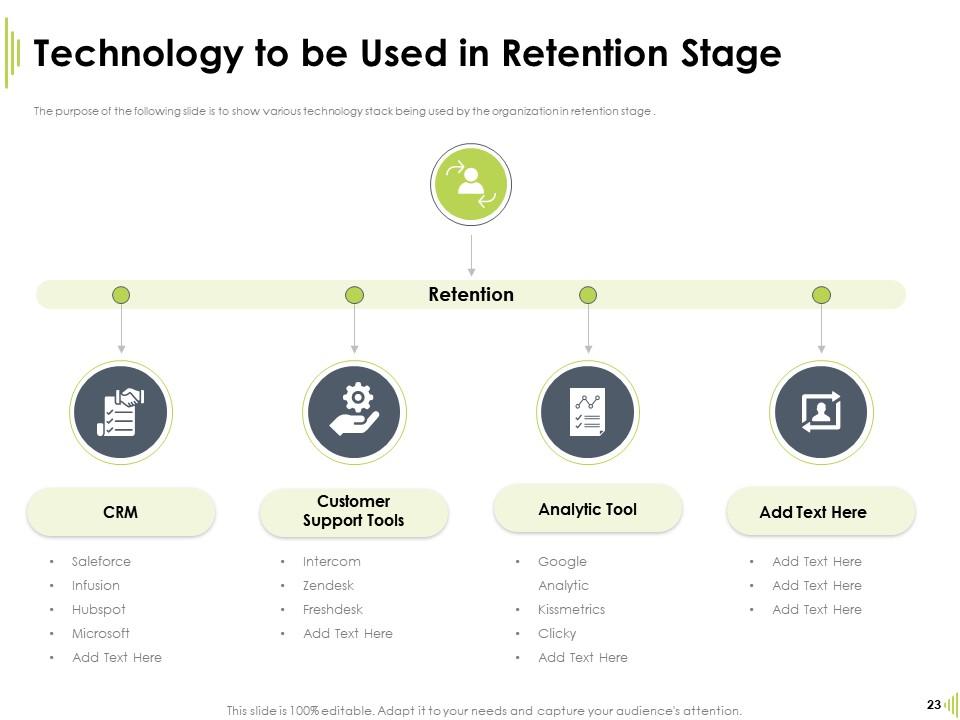
Slide 23: The purpose of the following slide is to show various technology stack being used by the organization in retention stage .
Slide 24: This slide explains Loyalty
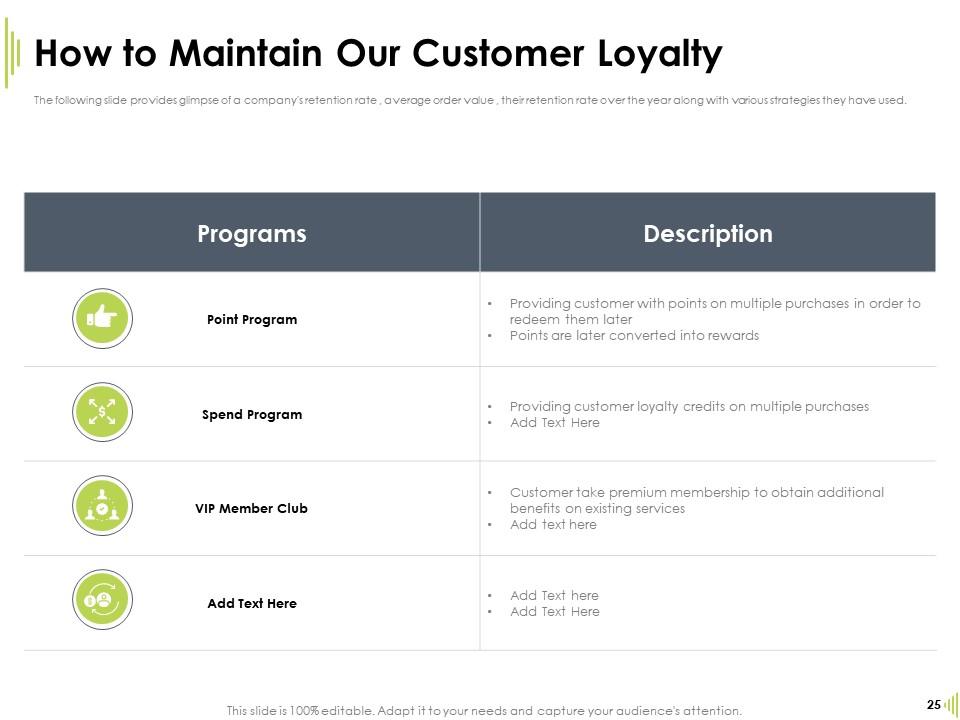
Slide 25: The following slide provides glimpse of a company's retention rate , average order value , their retention rate over the year along with various strategies they have used.
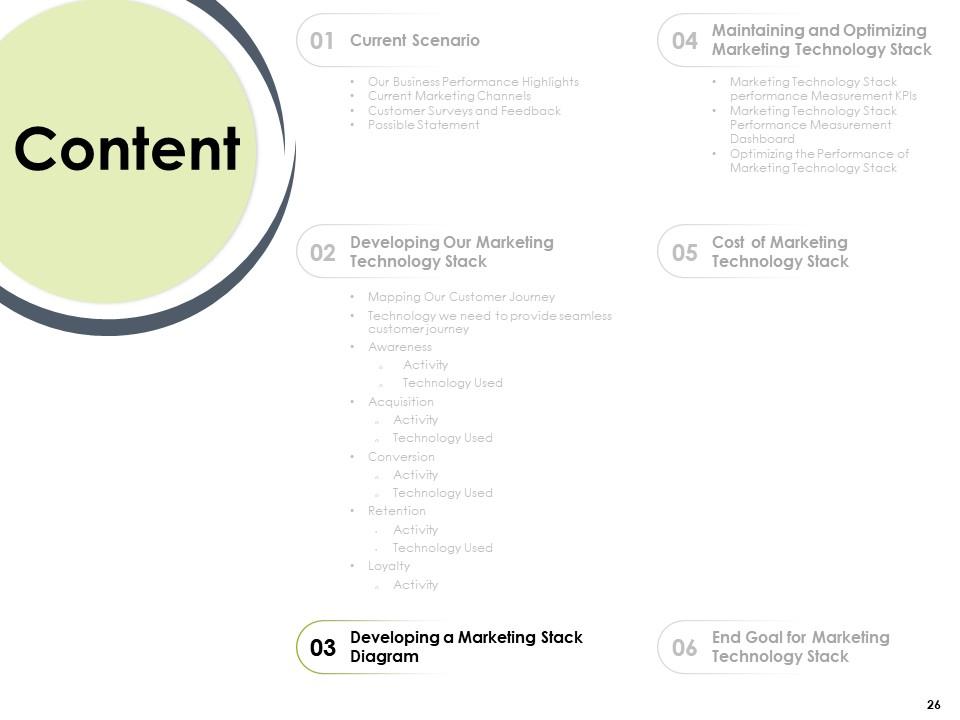
Slide 26: This slide displays Content.
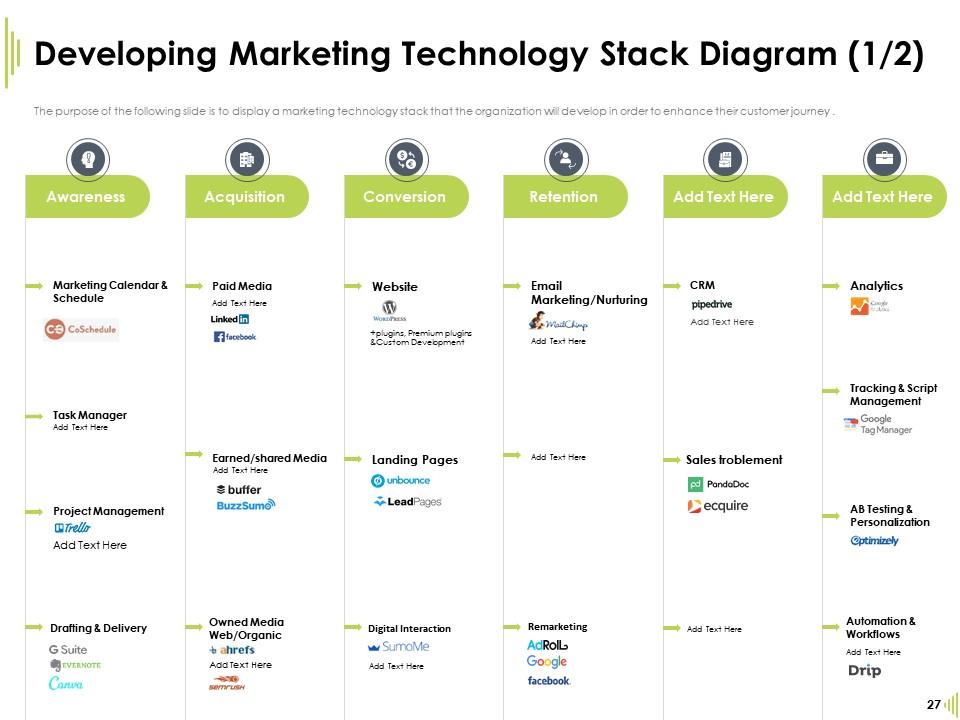
Slide 27: The purpose of the following slide is to display a marketing technology stack that the organization will develop in order to enhance their customer journey.
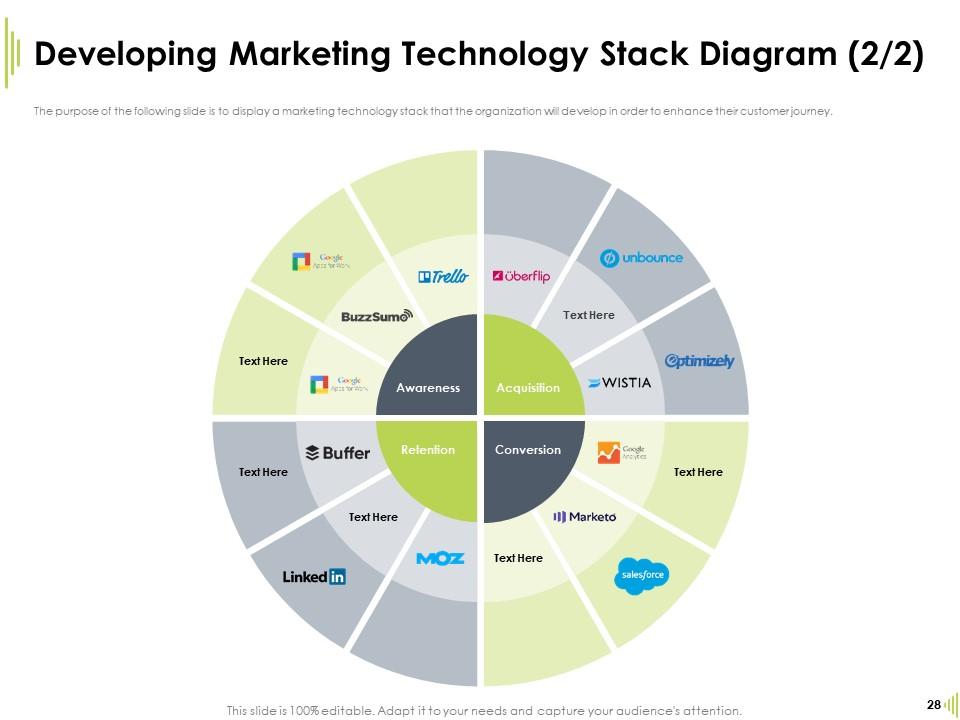
Slide 28: The purpose of the following slide is to display a marketing technology stack that the organization will develop in order to enhance their customer journey.
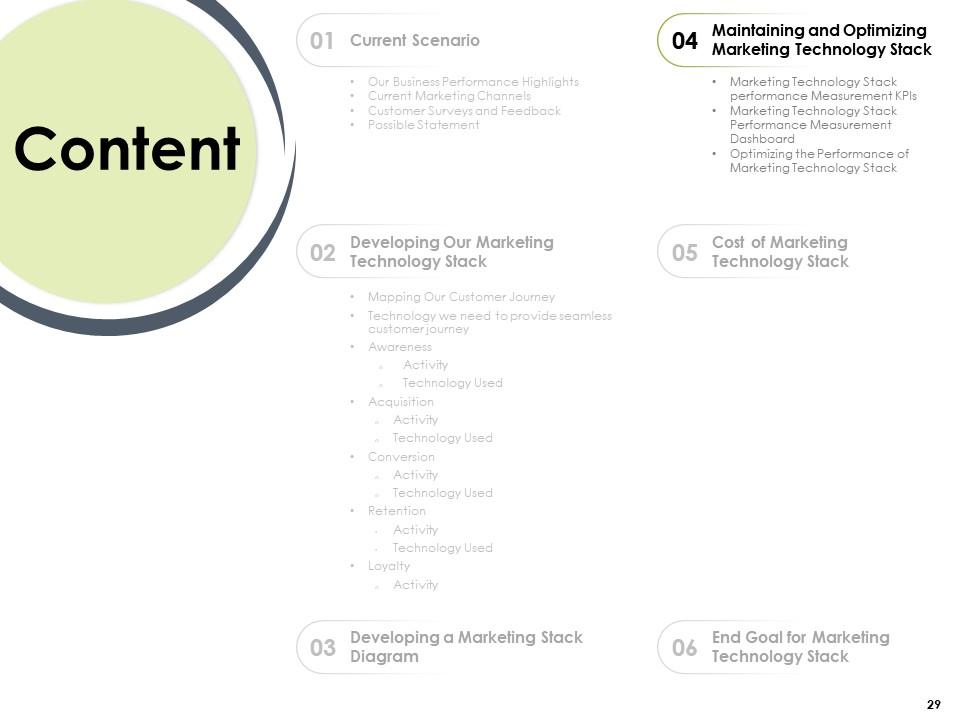
Slide 29: This slide displays Content.
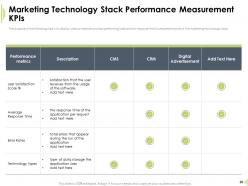
Slide 30: The purpose of the following slide is to display various metrices and key performing indicators to measure the future performance of the marketing technology stack
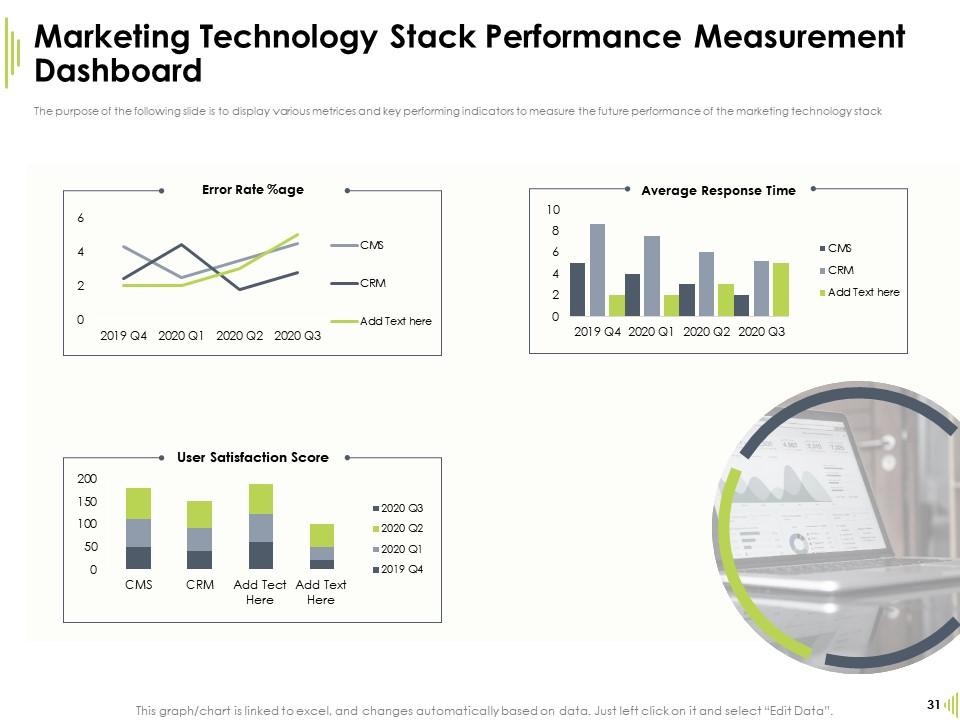
Slide 31: The purpose of the following slide is to display various metrices and key performing indicators to measure the future performance of the marketing technology stack
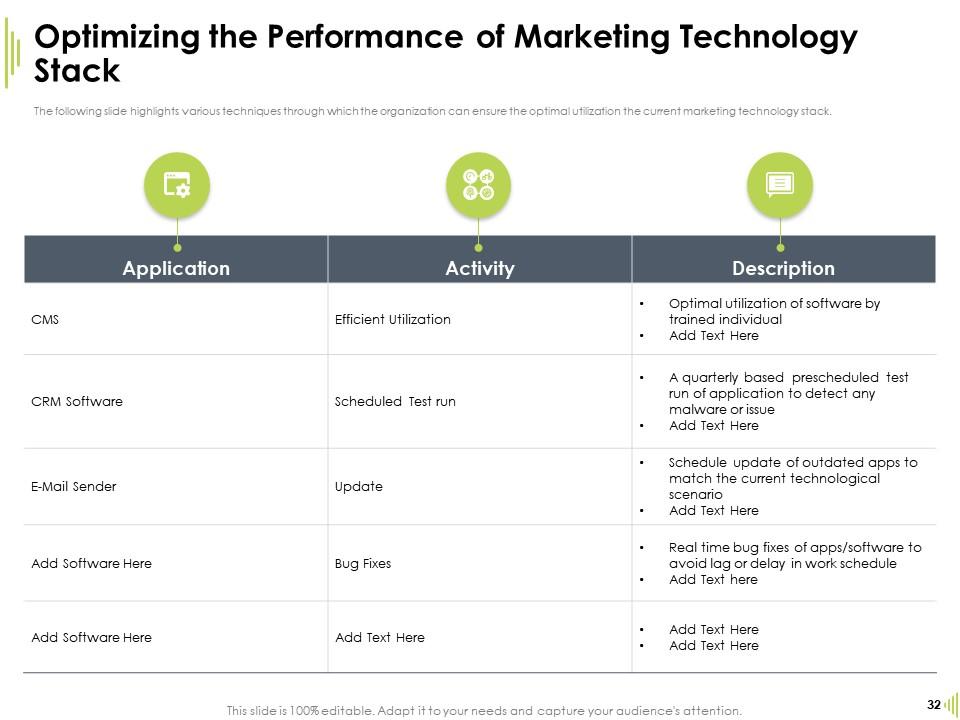
Slide 32: The following slide highlights various techniques through which the organization can ensure the optimal utilization the current marketing technology stack.
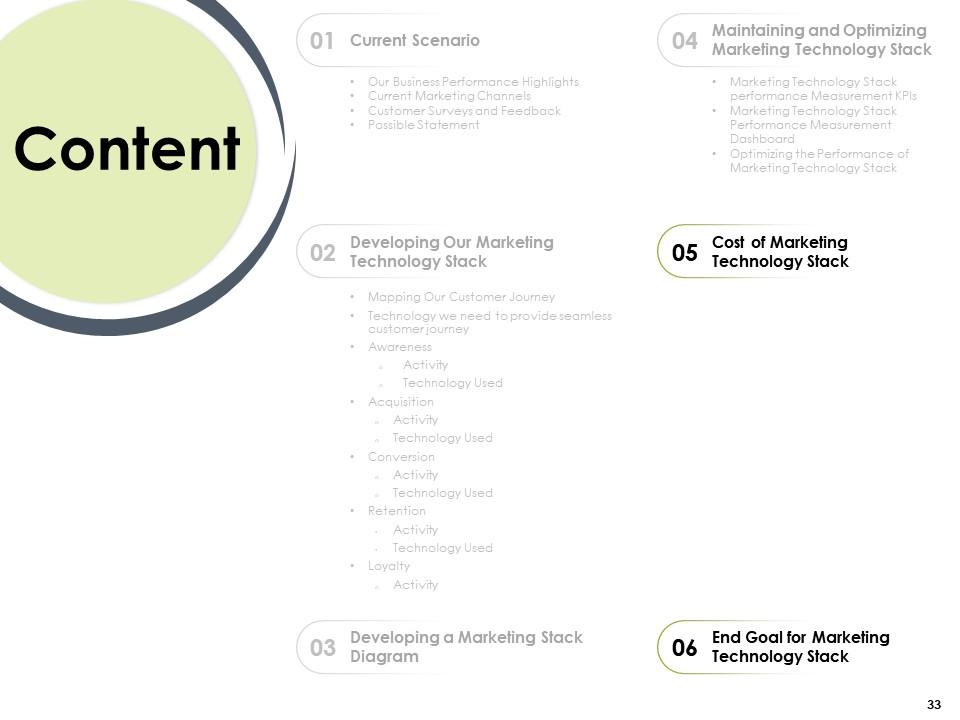
Slide 33: This slide displays Content of the presentation.
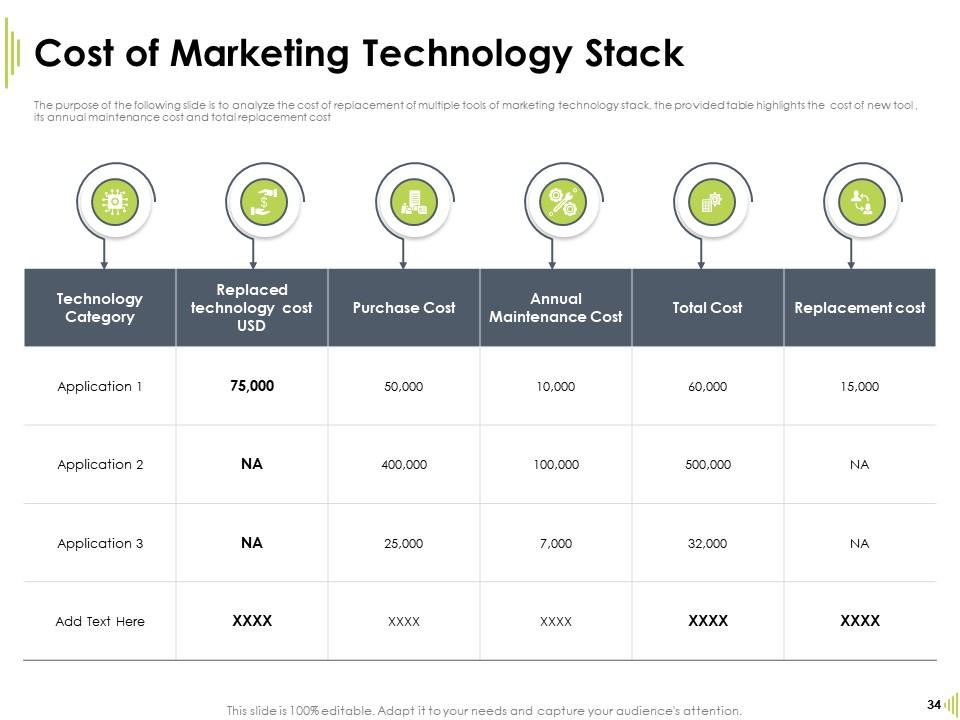
Slide 34: The purpose of the following slide is to analyze the cost of replacement of multiple tools of marketing technology stack, the provided table highlights the cost of new tool , its annual maintenance cost and total replacement cost
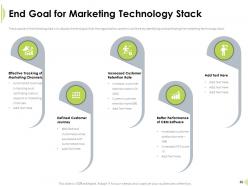
Slide 35: The purpose of the following slide is to display the end goal that the organization wants to achieve by identifying and optimizing the marketing technology stack.
Slide 36: This is Developing New Marketing Technology Stack Icons Slide
Slide 37: This slide is titled as Additional Slides for moving forward.
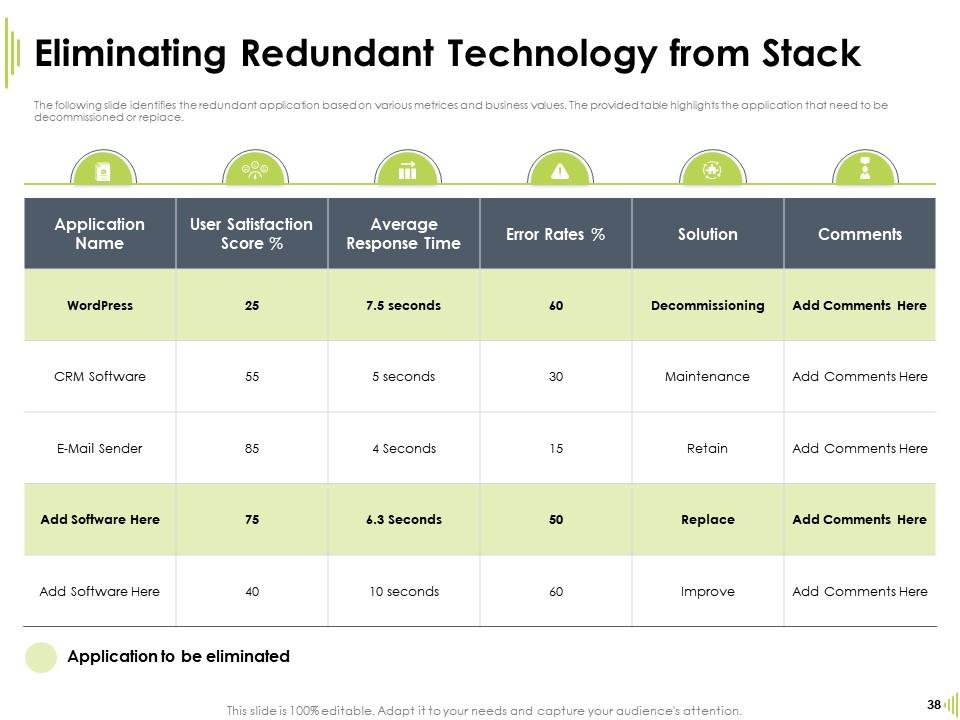
Slide 38: The following slide identifies the redundant application based on various metrices and business values. The provided table highlights the application that need to be decommissioned or replace.
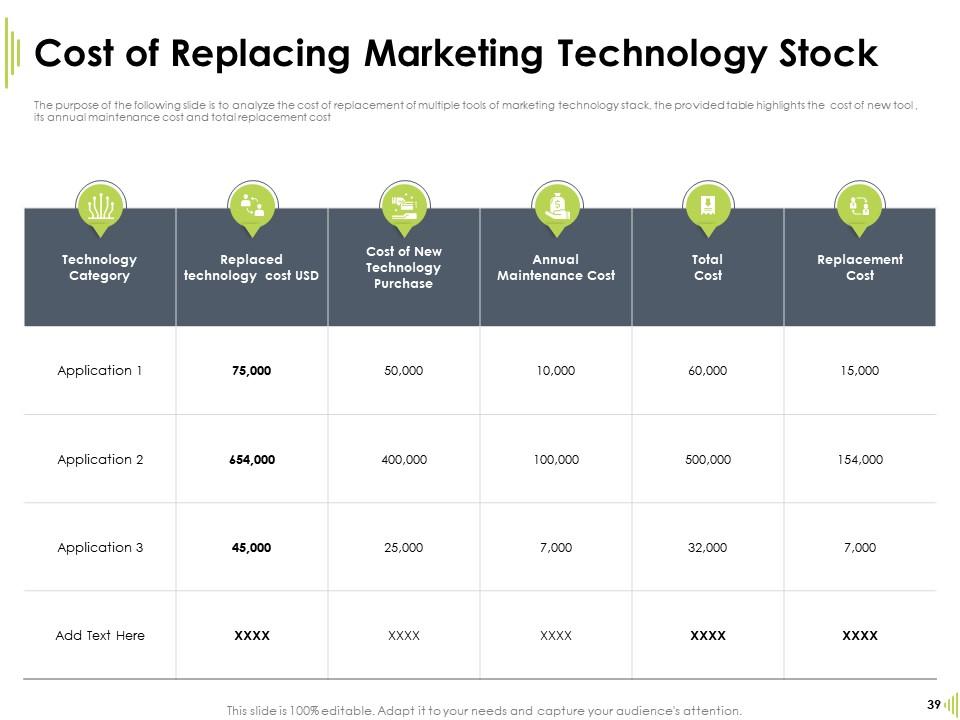
Slide 39: The purpose of the following slide is to analyze the cost of replacement of multiple tools of marketing technology stack, the provided table highlights the cost of new tool , its annual maintenance cost and total replacement cost
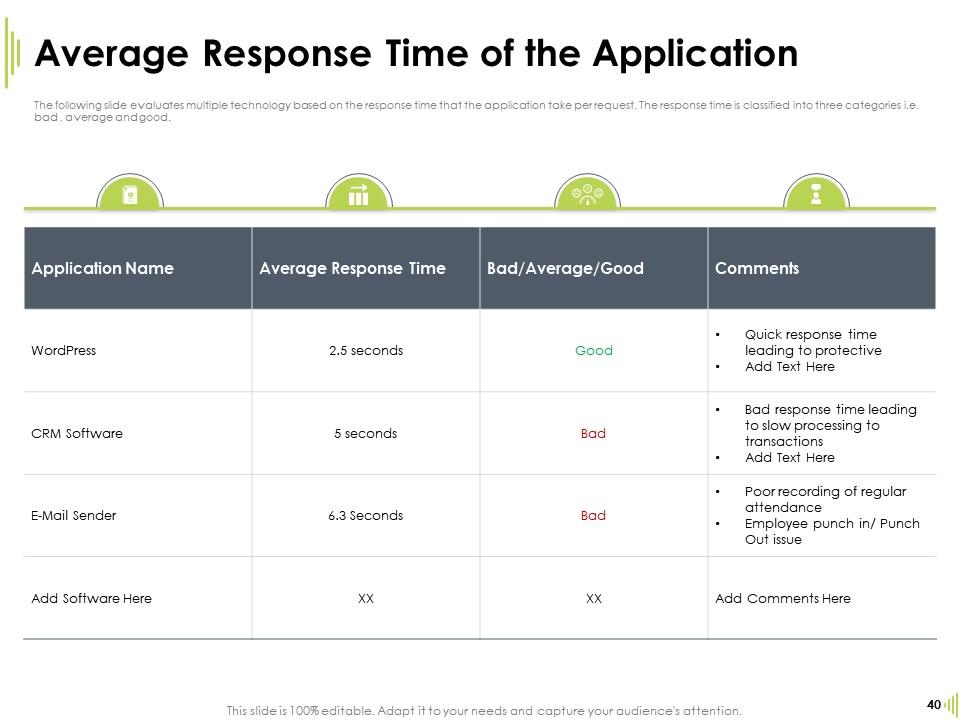
Slide 40: The following slide evaluates multiple technology based on the response time that the application take per request. The response time is classified into three categories i.e. bad , average and good.
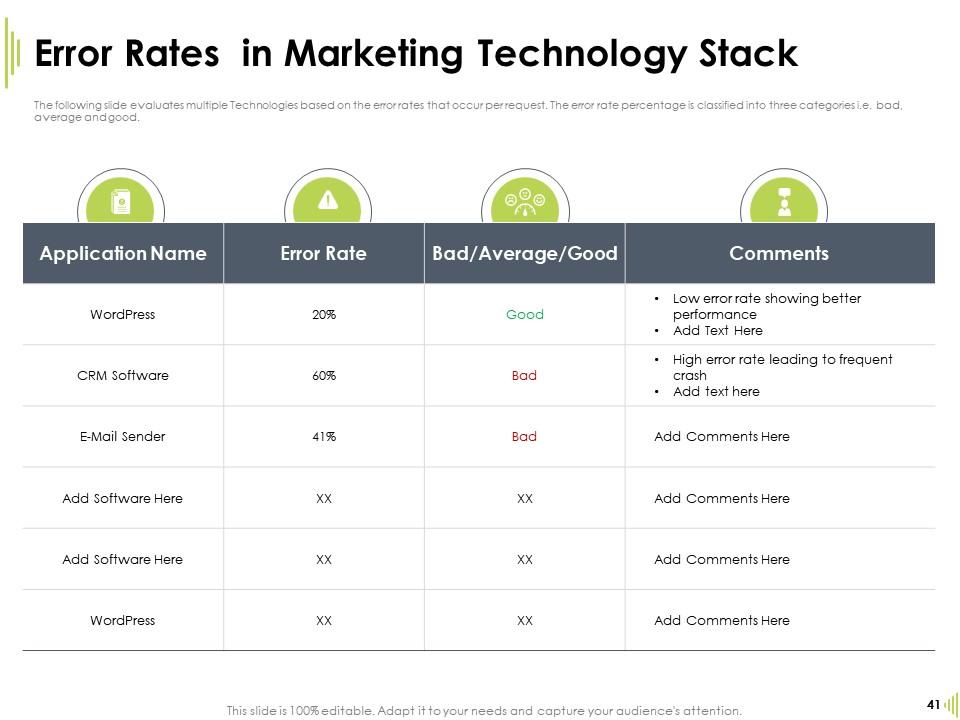
Slide 41: The following slide evaluates multiple Technologies based on the error rates that occur per request. The error rate percentage is classified into three categories i.e. bad, average and good.
Slide 42: This is About Us slide to showcase Company specifications.
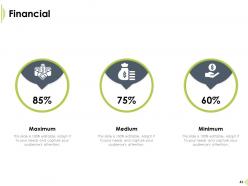
Slide 43: This is Financial slide.
Slide 44: This slide displays Our Team with Names and Designations.
Slide 45: This is Puzzle slide.
Slide 46: This is Thank You slide with Contact details.
Developing new marketing technology stack powerpoint presentation slides with all 46 slides:
Use our Developing New Marketing Technology Stack Powerpoint Presentation Slides to effectively help you save your valuable time. They are readymade to fit into any presentation structure.
-
The Designed Graphic are very professional and classic.
-
Awesome use of colors and designs in product templates.
-
Design layout is very impressive.
-
Use of different colors is good. It's simple and attractive.
-
Innovative and attractive designs.
-
Design layout is very impressive.
-
Good research work and creative work done on every template.
-
Much better than the original! Thanks for the quick turnaround.
-
Graphics are very appealing to eyes.
-
Unique research projects to present in meeting.


