


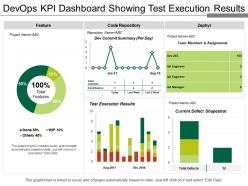
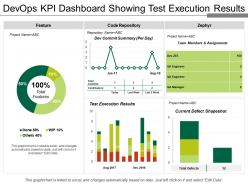
Devops kpi dashboard showing test execution results






Try Before you Buy Download Free Sample Product
 Impress Your
 Audience
 100%
100% Editable
 Save Hours
 of Time


Our Devops Kpi Dashboard Showing Test Execution Results are topically designed to provide an attractive backdrop to any subject. Use them to look like a presentation pro.
People who downloaded this PowerPoint presentation also viewed the following :
Devops kpi dashboard showing test execution results with all 8 slides:
Use our Devops Kpi Dashboard Showing Test Execution Results to effectively help you save your valuable time. They are readymade to fit into any presentation structure.



FAQs for Devops kpi dashboard showing
So basically you want four main things on your DevOps dashboard. Deployment stuff first - how often you're shipping and your lead times. Then failure rates and recovery time because yeah, things will break. Infrastructure metrics are huge too - uptime, response times, all that resource usage data. Oh and team velocity like cycle time and work in progress. Honestly though, start with maybe 6-8 metrics tops. Your team needs time to actually get used to checking the thing regularly before you go crazy adding more stuff. Too much data upfront just overwhelms everyone.
Honestly, just go with a simple line chart showing deployments over time - daily or weekly works best. Bar charts are solid too if that's more your thing. Definitely throw in one of those metric cards with your current average like "3.2 deployments/week" because bosses eat that stuff up. You can always color-code by team or environment later if you've got multiple pipelines. Keep it super basic at first. Anyone should be able to look at it and instantly know if you're shipping more or less. Short sentences work here. Don't overcomplicate it right away - you can add fancy stuff once people actually start using it.
MTTR tracks how fast you bounce back from outages - honestly one of the most telling DevOps metrics out there. Since you're shipping code all the time, stuff will break. The real question is whether your team takes 20 minutes or 4 hours to get things running again. Good MTTR means your monitoring actually works, your processes don't suck, and people know what they're doing. I'd start tracking it by incident type too - you might discover that database issues always drag on forever while API bugs get fixed quick. Seriously worth measuring if you aren't already.
Honestly, a good KPI dashboard is a game-changer for getting dev and ops to actually work together. Both teams end up staring at the same numbers - deployment frequency, lead times, how often stuff breaks, recovery times. No more pointing fingers when things go sideways. Developers finally get why ops freaks out about certain changes, and ops sees what's slowing down the dev process. You'll catch problems faster and actually celebrate wins together instead of working in silos. Pick maybe 3-4 metrics that both sides genuinely care about first - don't go overboard right away.
Don't try tracking everything at once - you'll just confuse everyone about what actually matters. Stick to maybe 4-6 metrics that connect to your team's real goals. Skip the vanity stuff like lines of code (honestly, such a waste of time). Go for deployment frequency, lead time, recovery time instead. Oh and remember your audience is key - what executives want to see is totally different from what engineers care about. I'd start with whatever metrics your team already looks at, then build from there based on what actually sparks useful discussions.
Focus on KPIs that actually show time and error reduction - that's where you'll see real impact. Track deployment frequency, lead time for changes, and mean time to recovery. Those tell the whole story. Also measure manual hours saved per week and compare failure rates before vs after. Don't go crazy with metrics though - I made that mistake once and got totally bogged down. Pick 3-4 that really matter for your specific stuff. Set up dashboards comparing your before/after baselines so you can show leadership the ROI. Trust me, they love seeing those numbers.
For incident tracking, there are three big ones you need: MTTD (how fast you catch problems), MTTA (when someone actually jumps on alerts), and MTTR (total fix time). That last one's honestly the most crucial - everyone obsesses over it. Also worth tracking escalation rates and first-call resolution if customers are involved. Oh, and don't forget to baseline where you're at now before changing anything. Otherwise you won't know if you're actually improving. Get these on a dashboard first, then focus on cutting down that resolution time while keeping detection quick.
Honestly, KPI dashboards are game-changers for DevOps stuff. You get real-time visibility into all your metrics, which helps you catch bottlenecks before they become huge problems. I love how you can actually see patterns in deployment frequency and failure rates instead of just reacting to whatever's broken today. The visual aspect makes team retrospectives way more focused too - you're working with actual data instead of just guessing what needs fixing. Oh, and watching those cycle times improve over time? Super motivating for the whole team. Don't forget to set up automated alerts for the important thresholds.
So customer satisfaction metrics are basically your reality check - they show if your fancy deployments actually help users or not. Perfect CI/CD means nothing if people are still dealing with bugs and downtime, you know? I've seen teams obsess over technical KPIs while completely ignoring user complaints. Track stuff like NPS scores and support tickets alongside your DevOps metrics. That way you get the full picture instead of just celebrating fast deployments while customers are quietly jumping ship. It's about connecting your internal wins to what actually matters for the business.
So here's what works for me - grab your code quality stuff (coverage, static analysis scores, tech debt) and plot it against deployment success rates. I usually pull from SonarQube or whatever you're using, plus your CI/CD data. After a few weeks you'll see the pattern clear as day - better quality scores mean way fewer rollbacks and emergency fixes. A simple scatter plot does the trick. Honestly, once you find those quality thresholds that match your cleanest deployments, it's like having a crystal ball for releases.
Honestly, it depends what you're already using, but Grafana's my go-to for dashboards - works with pretty much everything. Prometheus handles metrics really well, ELK stack for logs, Jenkins or GitLab for CI/CD stuff. DataDog and New Relic are great if you don't mind paying more for the convenience. I've watched teams spend forever building custom solutions when they could've just used Grafana with a couple data sources. Pick stuff that actually talks to your current setup instead of making you rebuild everything. Oh, and start small - maybe 3-4 important metrics first, then grow it out.
Dude, get a KPI dashboard set up - it'll show you compliance and security stuff in real time across your whole pipeline. Track vulnerability scans, policy violations, audit completeness, patch times. Honestly saves my butt with regulatory stuff constantly. You'll catch compliance gaps early instead of scrambling later. Plus it surfaces security trends that would just sit buried in logs forever. Oh, and definitely set automated alerts for the critical stuff so you're not glued to your screen all day. Way better than manual monitoring.
Honestly, go like 70-80% hard numbers - deployment frequency, lead times, error rates. That stuff gives you actual trends to work with. The rest should be softer metrics like team satisfaction or themes from post-mortems. I've watched teams get obsessed with pure data and completely miss when everyone's burning out, which kills productivity later anyway. Pick 3-4 solid quantitative metrics first. Then add maybe 2 qualitative ones that actually make sense for your situation. Review everything weekly as a team - your dashboard needs to show both if your system's healthy AND if your people are doing okay.
Honestly, treat your KPIs like they're actually alive - they need to change as your team grows. I'd set up quarterly check-ins to see if your metrics still make sense. Sometimes you'll find your team obsessing over deploy speed when quality is the real issue (been there). Talk to stakeholders about what's shifted. Check industry benchmarks. Don't feel bad about ditching metrics that aren't helping anymore - I know it feels weird but it's necessary. The trick is staying ahead of it instead of scrambling to catch up later. Oh, and actually put those quarterly reviews in your calendar today before you forget.
Look at your historical KPI data like it's showing you where to focus next. Trends over 6 months will tell you if deployment frequency is actually getting better or if tech debt keeps piling up (spoiler: it usually is). You'll spot patterns in outages and can predict when you'll need more capacity. The best part? You can see which tools or process changes actually worked versus the ones that just looked good on paper. Honestly, most teams set goals based on what they hope will happen instead of what their data shows is realistic. Start with those 6-month trends.
-
Enough space for editing and adding your own content.
-
Informative design.