


Digital Marketing KPI Dashboard With Goal Conversion Rate




Try Before you Buy Download Free Sample Product
 Impress Your
 Audience
 100%
100% Editable
 Save Hours
 of Time


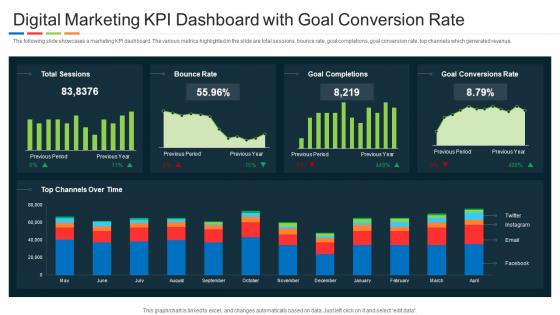
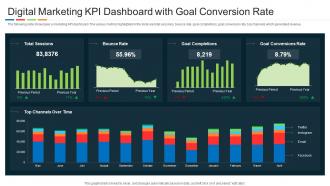
The following slide showcases a marketing KPI dashboard. The various metrics highlighted in the slide are total sessions, bounce rate, goal completions, goal conversion rate, top channels which generated revenue.
People who downloaded this PowerPoint presentation also viewed the following :
Digital Marketing KPI Dashboard With Goal Conversion Rate with all 7 slides:
Use our Digital Marketing KPI Dashboard With Goal Conversion Rate to effectively help you save your valuable time. They are readymade to fit into any presentation structure.





FAQs for Digital Marketing KPI Dashboard With
Essential digital marketing KPIs include website traffic, conversion rates, cost per acquisition, return on ad spend, and customer lifetime value. These metrics streamline campaign optimization by tracking engagement patterns, measuring ROI effectiveness, and identifying high-performing channels, with many marketing teams finding that comprehensive dashboards ultimately deliver faster decision-making and improved budget allocation.
Businesses can tailor KPI dashboards by selecting metrics that directly measure their specific objectives, such as conversion rates for sales goals, engagement metrics for brand awareness, and customer acquisition costs for growth targets. Through customizable visualization tools and segmented data views, companies across retail, SaaS, and financial services streamline performance tracking, enhance strategic decision-making, and ultimately accelerate goal achievement.
Data visualization transforms complex marketing metrics into clear, actionable insights by presenting KPIs through charts, graphs, heat maps, and trend lines that enable immediate pattern recognition. Through intuitive visual formats, marketing teams can quickly identify campaign performance gaps, spot emerging opportunities, and make data-driven decisions faster, ultimately enhancing strategic responsiveness and competitive advantage.
Digital marketing KPI dashboards should be updated in real-time for paid advertising and social media metrics, daily for website analytics and email campaigns, and weekly for SEO and content performance indicators. This strategic approach enables marketing teams to respond quickly to campaign shifts, optimize budget allocation efficiently, and maintain competitive advantage through timely data-driven decisions.
**INPUT**: What tools are best for creating a comprehensive digital marketing KPI dashboard? **OUTPUT**: Top tools for comprehensive digital marketing KPI dashboards include Google Analytics, HubSpot, Tableau, Power BI, and Looker Studio, each offering robust data integration and visualization capabilities. These platforms streamline campaign tracking, automate reporting processes, and enhance decision-making through real-time insights, with many marketing teams finding that centralized dashboards ultimately deliver improved ROI visibility and faster strategic adjustments. [Word count: 60 words]
Businesses can effectively track lead generation and conversion metrics through automated data integration, real-time funnel visualization, source attribution tracking, and conversion rate monitoring across channels. Through centralized dashboards, organizations streamline performance analysis, identify high-converting sources, and optimize campaign allocation, while enabling faster decision-making and improved ROI measurement, ultimately delivering enhanced marketing efficiency and competitive advantage.
Best practices for designing intuitive digital marketing KPI dashboards include prioritizing key metrics over data overload, using clear visual hierarchies, implementing real-time data integration, and ensuring mobile responsiveness across devices. These approaches streamline decision-making by presenting actionable insights through color-coded performance indicators, customizable views, and automated alerts, with many marketing teams finding that well-designed dashboards ultimately enhance campaign optimization and deliver faster strategic adjustments.
Real-time data tracking enhances digital marketing decision-making by enabling immediate campaign adjustments, identifying trending content opportunities, and optimizing budget allocation across channels as performance shifts occur. Through live analytics dashboards, marketing teams can pivot strategies within hours rather than weeks, respond to audience engagement patterns instantly, and maximize ROI by reallocating resources to high-performing campaigns, ultimately delivering more agile and effective marketing outcomes.
Social media engagement metrics are effectively represented through visual elements like engagement rate charts, follower growth trends, comment-to-post ratios, share velocity indicators, and audience sentiment analysis graphs. These dashboard components enable marketing teams to track performance across platforms like Instagram, LinkedIn, and Twitter, while identifying content strategies that drive meaningful interactions, ultimately delivering improved brand awareness and customer relationship building in an increasingly competitive digital landscape.
Common pitfalls include tracking vanity metrics over actionable KPIs, creating overly complex dashboards that obscure insights, failing to align metrics with business objectives, and neglecting real-time data integration. These mistakes often lead to poor decision-making and wasted resources, with many marketing teams finding that focusing on conversion rates, customer acquisition costs, and ROI rather than just likes or impressions delivers clearer strategic direction and measurable business growth.
Different marketing channels significantly influence KPI selection, with SEO requiring organic traffic, keyword rankings, and conversion tracking, while PPC demands cost-per-click, quality scores, and ROI metrics, and social media focuses on engagement rates, reach, and brand sentiment. These channel-specific KPIs enable marketers to optimize budget allocation, measure campaign effectiveness across touchpoints, and deliver comprehensive performance insights that drive strategic decisions and competitive advantage.
Setting benchmarks for each KPI provides essential reference points for measuring performance, identifying improvement opportunities, and making data-driven decisions effectively. These benchmarks enable marketing teams to evaluate campaign success, allocate resources strategically, and demonstrate ROI to stakeholders, with many organizations finding that benchmark-driven dashboards ultimately deliver enhanced accountability and competitive advantage in increasingly dynamic digital landscapes.
Businesses can refine their digital marketing KPI dashboard by analyzing A/B testing results to identify high-performing metrics, eliminate underperforming indicators, and adjust measurement priorities based on conversion data. Through systematic testing of dashboard layouts, metric combinations, and visualization formats, organizations streamline decision-making processes while enhancing campaign performance tracking, ultimately delivering more accurate ROI measurements and strategic insights.
CLV analysis in KPI dashboards reveals customer profitability patterns, acquisition cost efficiency, retention rates across segments, and revenue forecasting opportunities. These insights enable businesses to optimize marketing spend allocation, identify high-value customer characteristics, and develop targeted retention strategies, with many organizations finding significantly improved ROI and enhanced customer relationship management.
Integrating CRM data enhances digital marketing KPI dashboards by connecting customer lifecycle stages, purchase history, and engagement patterns with campaign performance metrics. This strategic combination enables marketers to track lead quality, customer acquisition costs, and lifetime value more accurately, while identifying which channels drive highest-value customers, ultimately delivering deeper ROI insights and more targeted campaign optimization.
-
Illustrative design with editable content. Exceptional value for money. Highly pleased with the product.
-
Great product with highly impressive and engaging designs.