


Evaluation of companys performance powerpoint presentation slides





Try Before you Buy Download Free Sample Product
 Impress Your
 Audience
 100%
100% Editable
 Save Hours
 of Time


Our Evaluation Of Companys Performance Powerpoint Presentation Slides are topically designed to provide an attractive backdrop to any subject. Use them to look like a presentation pro.
People who downloaded this PowerPoint presentation also viewed the following :
Content of this Powerpoint Presentation
Slide 1: This slide introduces Evaluation of Company's Performance. State your Company name and begin.
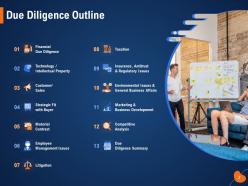
Slide 2: This slide depicts Outline of Due Diligence.
Slide 3: This slide showcases Financial Due Diligence
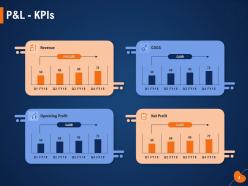
Slide 4: This slide depicts P&L - KPIs.
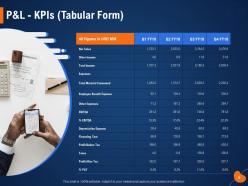
Slide 5: This slide showcases P&L - KPIs in tabular form.
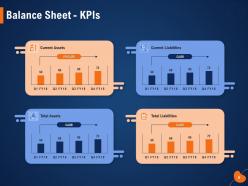
Slide 6: This slide depicts Balance Sheet - KPIs
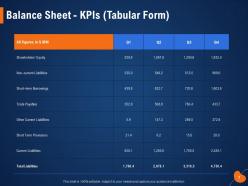
Slide 7: This slide shows Balance Sheet - KPIs in Tabular Form.
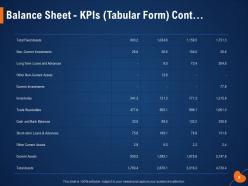
Slide 8: This slide showcases Total Assets of the Organization.
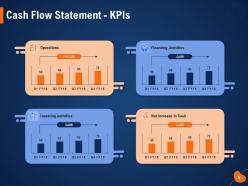
Slide 9: This slide showcases Cash Flow Statement - KPIs.
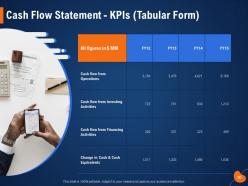
Slide 10: This slide presents Cash Flow Statement - KPIs in Tabular Form.
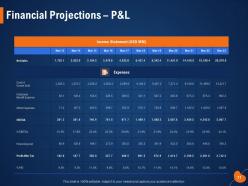
Slide 11: This slide depicts Financial Projections – P&L.
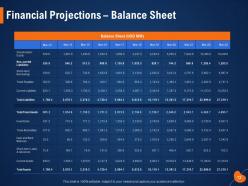
Slide 12: This slide displays Financial Projections – Balance Sheet.
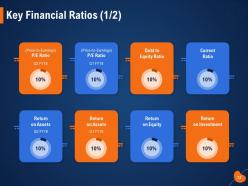
Slide 13: This slide presents Key Financial Ratios.
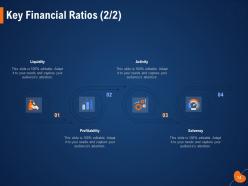
Slide 14: This slde presents Key Financial Ratios with- Profitability, Liquidity, Activity, Solvency.
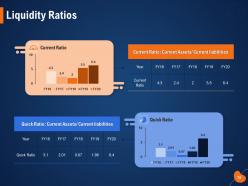
Slide 15: This slide depicts Liquidity Ratios.
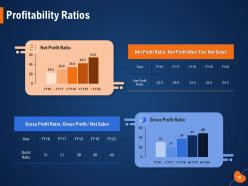
Slide 16: This slide showcases Profitability Ratios.
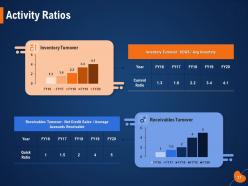
Slide 17: This slide presents Activity Ratios.
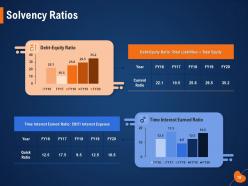
Slide 18: This slide showcases Solvency Ratios.
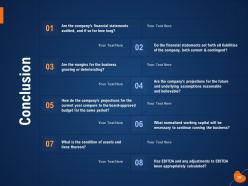
Slide 19: This slide showcases Conclusion.
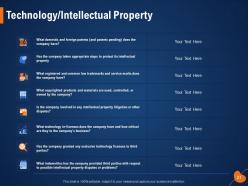
Slide 20: This slide describes Technology/Intellectual Property.
Slide 21: This slide depicts Technology/Intellectual Property.
Slide 22: This slide showcases Customers/Sales.
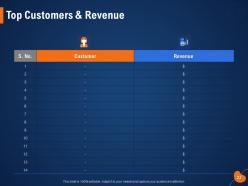
Slide 23: This slide displays Top Customers & Revenue
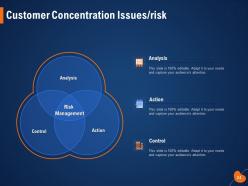
Slide 24: This slide showcases Customer Concentration Issues/Risk.
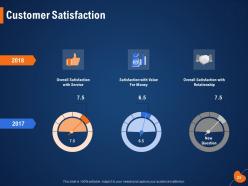
Slide 25: This slide showcases Customer Satisfaction with- Key Performance Indicators
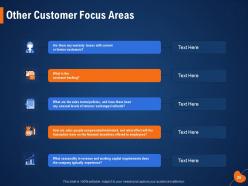
Slide 26: This slide depicts Other Customer Focus Areas.
Slide 27: This slide displays Strategic Fit with Buyer
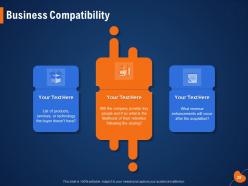
Slide 28: This slide showcases Business Compatibility.
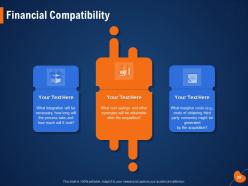
Slide 29: This slide displays Financial Compatibility.
Slide 30: This slide displays Material and Contract with related inforamtion.
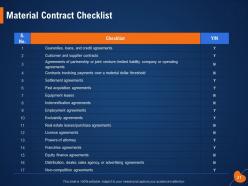
Slide 31: This slide displays Material Contract Checklist.
Slide 32: This slide displays Employee Management Issues.
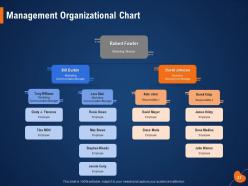
Slide 33: This slide showcases Management Organizational Chart.
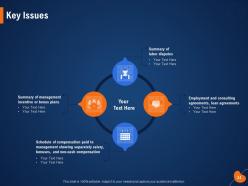
Slide 34: This slide showcases Key Issues.
Slide 35: This slide describes Litigation.
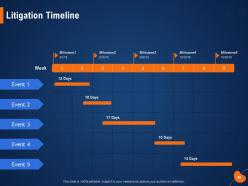
Slide 36: This slide showcases Litigation Timeline.
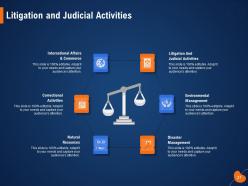
Slide 37: This slide presents Litigation and Judicial Activities.
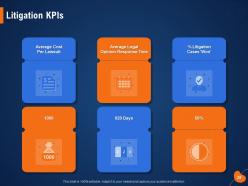
Slide 38: This slide showcases Litigation KPIs.
Slide 39: This slide showcases Taxation.
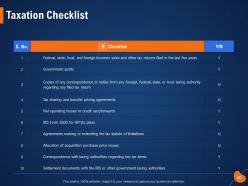
Slide 40: This slide depicts Taxation Checklist
Slide 41: This slide showcases Insurance Antitrust & Regulatory Issues.
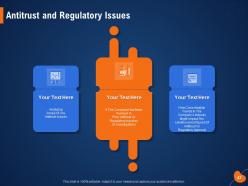
Slide 42: This slide showcases Antitrust and Regulatory Issues.
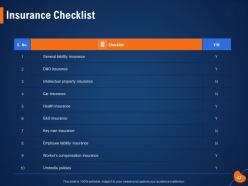
Slide 43: This slide displays Insurance Checklist.
Slide 44: This slide describes Environmental Issues & General Business Affairs.
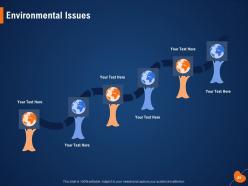
Slide 45: This slide presents Environmental Issues.
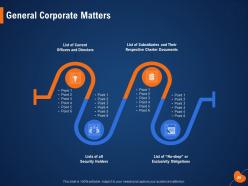
Slide 46: This slide showcases General Corporate Matters with- List of Current Officers and Directors, Lists of all Security Holders, List of subsidiaries and their respective charter documents, List of “No-shop” or exclusivity obligations.
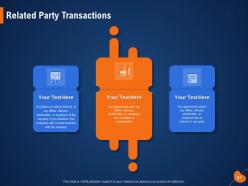
Slide 47: This slide depicts Related Party Transactions
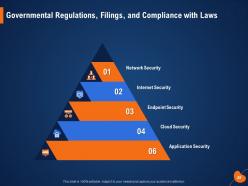
Slide 48: This slide showcases Governmental Regulations Filings and Compliance with Laws.
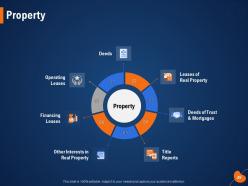
Slide 49: This slide showcases Property with- Deeds, Leases of Real Property, Deeds of Trust & Mortgages, Title Reports, Other Interests in Real Property, Financing Leases, Operating Leases.
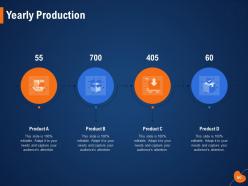
Slide 50: This slide showcases Yearly Production with products.
Slide 51: This slide depicts Marketing & Business Development.
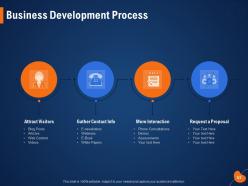
Slide 52: This slide depicts Business Development Process.
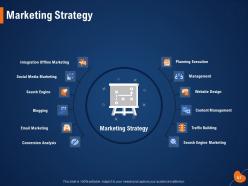
Slide 53: This slide showcases Marketing Strategy.
Slide 54: This slide showcases Competitive Analysis.
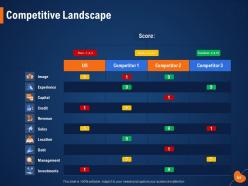
Slide 55: This slide shows Competitive Landscape.
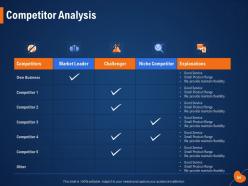
Slide 56: This slide depicts Competitor Analysis.
Slide 57: This slide presents the Summary.
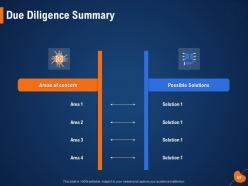
Slide 58: This slide showcases Due Diligence Summary
Slide 59: This is Evaluation of Company’s Performance Icons Slide.
Slide 60: This slide reminds about Coffee break.
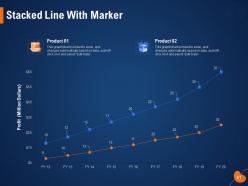
Slide 61: This slide displays Stacked Line With Marker for comparison of products.
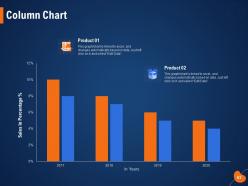
Slide 62: This slide displays Column Chart for comparison of products.
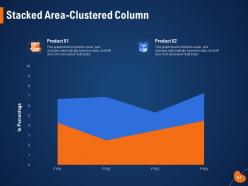
Slide 63: This slide shows Stacked Area-Clustered Column for comparison of products.
Slide 64: This slide is title as Additional Slides for moving forward.
Slide 65: This is Our Awesome Team slide with Names and Designations.
Slide 66: This is About us slide to showcase Company.
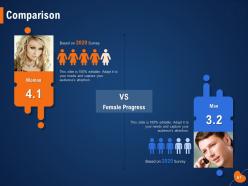
Slide 67: This slide displays Comparison.
Slide 68: This slide showcases Our Vision, Mission and Goal
Slide 69: This slide displays Puzzle
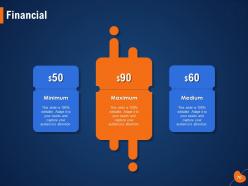
Slide 70: This slide shows Finance related stuff.
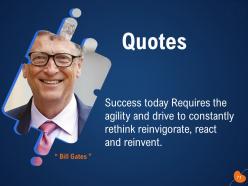
Slide 71: This slide represents quotes.
Slide 72: This is Thank you slide with Contact details.
Evaluation of companys performance powerpoint presentation slides with all 72 slides:
Use our Evaluation Of Companys Performance Powerpoint Presentation Slides to effectively help you save your valuable time. They are readymade to fit into any presentation structure.














FAQs for Evaluation of companys performance
Companies should monitor a range of KPIs to effectively evaluate performance, including financial metrics like revenue growth, profitability, and return on investment, operational efficiency indicators such as customer acquisition cost, production cycle time, and inventory turnover, and customer satisfaction metrics like net promoter score, customer churn rate, and average customer lifetime value. These KPIs, when analyzed together, provide a comprehensive understanding of a company's financial health, operational effectiveness, and customer relationships, ultimately enabling data-driven decision-making for growth and improvement.
A company's financial statements, including the balance sheet, income statement, and cash flow statement, provide a comprehensive picture of its financial health and viability. By analyzing these statements, stakeholders can assess profitability (income statement), liquidity (balance sheet), and cash flow generation (cash flow statement). Examining key ratios like profitability margins, debt-to-equity ratios, and current ratios can reveal trends in performance, risk, and the company's ability to meet its financial obligations. This data-driven evaluation empowers informed decision-making regarding investments, lending, and strategic planning, ultimately contributing to the company's long-term success.
Customer feedback plays a crucial role in evaluating a company's performance by providing direct insights into customer satisfaction, product/service quality, and overall brand perception. It highlights areas of strength, identifies areas for improvement, and helps companies tailor their offerings to meet evolving customer needs. By analyzing customer feedback through surveys, reviews, and social media interactions, companies can gain a comprehensive understanding of their performance and make data-driven decisions to enhance customer experiences and drive business growth.
Workforce productivity metrics, such as output per employee, project completion rates, and customer satisfaction scores, directly influence performance assessment by providing quantifiable measures of individual and team effectiveness. These metrics enable organizations to identify high-performing individuals and teams, pinpoint areas for improvement, and track progress toward strategic goals, ultimately driving data-driven decision-making for performance reviews, talent allocation, and process optimization across various departments, from sales and marketing to operations and customer service.
Market share serves as a key indicator of a company's competitive standing by reflecting its ability to capture customer preference within a specific market. A larger market share generally signifies stronger brand recognition, customer loyalty, and a more robust competitive position, especially in industries like retail, where banks, and manufacturing, where companies with higher market share often enjoy economies of scale and greater bargaining power with suppliers.
Industry benchmarks provide a crucial framework for evaluating a company's performance by offering comparative data points across key metrics such as revenue growth, profit margins, customer satisfaction, and operational efficiency. These benchmarks allow companies to assess their strengths and weaknesses relative to their peers, identifying areas where they excel and areas needing improvement. For instance, a retail company can compare its sales conversion rate to the industry average, highlighting opportunities to optimize its marketing or sales strategies, ultimately driving revenue growth and enhancing competitive advantage.
Evaluating a company's performance goes beyond just numbers; qualitative factors offer crucial insights into its overall health. These include employee morale and engagement, customer satisfaction and loyalty, brand reputation and perception, and the company's adaptability to market changes. While financial metrics like revenue and profit are important, these qualitative factors paint a richer picture of the company's long-term sustainability and competitive advantage, ultimately influencing its ability to innovate, attract talent, and build lasting customer relationships.
A balanced scorecard improves performance evaluations by broadening the scope beyond just financial metrics. It incorporates perspectives like customer satisfaction, internal processes, and learning & growth, providing a more holistic view of company success. Through these diverse lenses, organizations can identify strengths and weaknesses across all key areas, enabling strategic adjustments to drive sustainable growth and competitive advantage.
Return on investment (ROI) is a crucial metric that quantifies the profitability of a company's investments relative to its costs. It demonstrates the efficiency of resource allocation by showing how effectively a company generates profits from its expenditures, allowing for comparisons across different projects, departments, or even entire business units. With many companies finding that a higher ROI indicates better strategic decision-making and improved financial health, it serves as a key indicator of overall business success.
Employee satisfaction and engagement metrics can significantly correlate with overall company performance by influencing productivity, innovation, and customer experiences. For instance, when employees feel valued and connected to their work, they demonstrate higher levels of productivity, contributing to increased sales and revenue for companies like Google and Salesforce. Moreover, engaged employees are more likely to generate innovative ideas, leading to improved products and services, while also delivering exceptional customer experiences that foster loyalty and brand advocacy.
Evaluating operational efficiency during performance review involves analyzing key metrics like productivity, resource allocation, and cycle times. These methods can include benchmarking against industry standards, conducting process mapping to identify bottlenecks, and analyzing key performance indicators (KPIs) specific to each department, such as customer service response times in retail or production output in manufacturing. These insights help organizations pinpoint areas for improvement, streamline workflows, and ultimately enhance profitability and customer satisfaction.
External economic factors significantly influence the assessment of a company's performance by impacting revenue streams, operational costs, and market demand. For example, rising inflation can erode profit margins while increased interest rates make borrowing more expensive, impacting expansion plans. Financial institutions, in particular, face challenges navigating volatile interest rates and economic uncertainty, while retailers may struggle with shifting consumer spending patterns. Ultimately, understanding these macroeconomic forces allows companies to adjust strategies and mitigate risks, ensuring a more accurate and comprehensive performance evaluation.
Integrating technology and innovation metrics into performance evaluations can encompass various aspects, including measuring employee proficiency in new tools, tracking contributions to digital transformation projects, and assessing the adoption and impact of innovative ideas. These metrics can be incorporated into existing performance reviews by establishing clear goals, utilizing data analytics platforms to track progress, and aligning individual contributions with the company's overall innovation strategy. Ultimately, this integration fosters a culture of continuous improvement, encourages employees to embrace technological advancements, and drives organizational growth through innovation.
A company's corporate social responsibility (CSR) initiatives can significantly influence its performance assessment by demonstrating its commitment to ethical and sustainable practices. These initiatives can enhance brand reputation and customer loyalty, attracting conscious consumers and investors who prioritize responsible business conduct. Moreover, by focusing on environmental sustainability and social impact, companies can reduce operational costs, mitigate risks, and improve employee engagement, ultimately leading to enhanced profitability and long-term growth.
Standardizing performance evaluations across departments presents challenges such as varying job roles, diverse skill sets, and departmental goals. While this can ensure consistency and fairness, it can also be difficult to create a system that accurately reflects the unique contributions of each role, potentially leading to dissatisfaction or a lack of motivation among employees. Ultimately, companies must find a balance between standardization and departmental specificity to create a system that is both effective and motivating for all.
-
Enough space for editing and adding your own content.
-
Informative presentations that are easily editable.
-
Awesomely designed templates, Easy to understand.