


Example of business operations analysis powerpoint presentation slides





Try Before you Buy Download Free Sample Product
 Impress Your
 Audience
 100%
100% Editable
 Save Hours
 of Time


Get this attention-grabbing Example Of Business Operations Analysis PowerPoint Presentation Slides to increase the value of your enterprise. This business process analysis PPT slide deck consists of a varied range of templates like market size globally, infrastructure services, key funding areas, technology trends in infrastructure, drivers for sustainable infrastructure management. Describe the asset management process by utilizing business operation management PPT templates. You can also discuss your business goals and expectations with the help of this slide deck. These slides also help in analyzing the current financial situation of the firm. Discuss the implementation of the new financial plan by using our engaging PPT infographics. Depict the stages of asset management lifecycle like procurement, retirement, and disposal, deploy and discover. Take the assistance of this business operations example PPT slide deck to discuss deterioration modeling. You can further explain types of models like asset deterioration modeling, risk assessment, and deterioration modeling. Provide information on value-driven decision-making methodology, asset management decision journey, performance, and cost function. Plan your operations efficiently by downloading these strategic planning process PPT visuals.
People who downloaded this PowerPoint presentation also viewed the following :
Content of this Powerpoint Presentation
Slide 1: This slide introduces Example of Business Operations Analysis. State your Company name and begin.
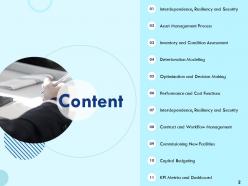
Slide 2: This slide displays Table of Content.
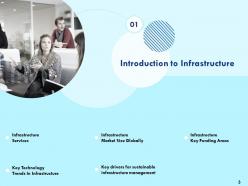
Slide 3: This slide shows Introduction to Infrastructure
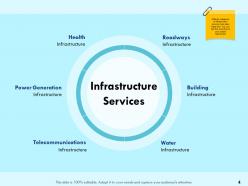
Slide 4: Different categories of Infrastructure services have been listed in this slide. You can edit this according to your project requirement.
Slide 5: This bar graph shows market size for consecutive years. You can edit this as per your requirement.
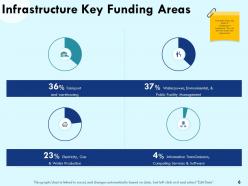
Slide 6: This slide shows key areas of infrastructure investment. You can edit this as per your requirement.
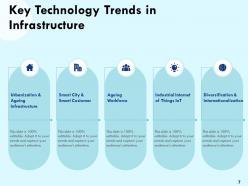
Slide 7: This slide presents Key Technology Trends in Infrastructure.
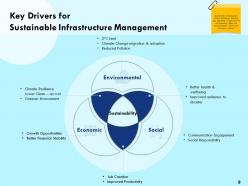
Slide 8: This slide shows Key Drivers for Sustainable Infrastructure Management Sustainable infrastructure means designing, building, and operating in ways that do not adversely effect the environmental, social, and economic system.
Slide 9: This slide depicts Asset Management Process.
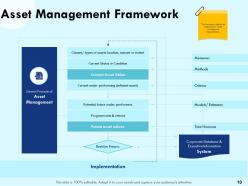
Slide 10: This framework depicts an organisation's asset management responsibilities.
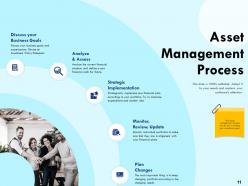
Slide 11: This slide shows Asset Management Process.
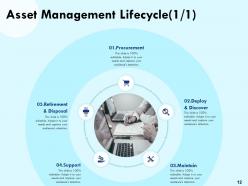
Slide 12: This slide presents Asset Management Lifecycle.
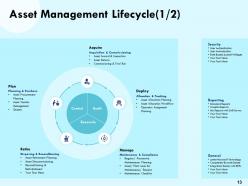
Slide 13: This slide shows Asset Management Lifecycle
Slide 14: This slide depicts Asset and Condition Assessment.
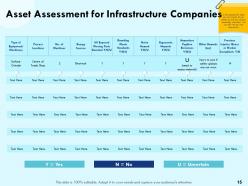
Slide 15: In this assessment table you can include all your assets as well any hazards associated with them. You can edit it as per your requirement.
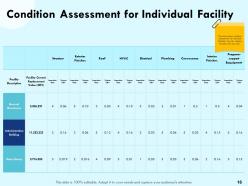
Slide 16: This slide shows condition assessment for individual facilities. You can replace the data with your own.
Slide 17: This slide depicts Deterioration Modelling.
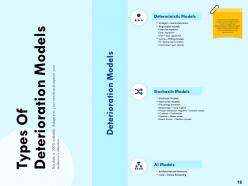
Slide 18: This slide depicts Types Of Deterioration Models ience's attention.
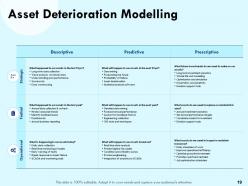
Slide 19: This slide shows the past and future condition of your assets and also prescriptive measures to be taken.
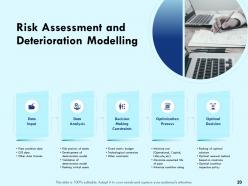
Slide 20: This slide showcases Risk Assessment and Deterioration Modelling
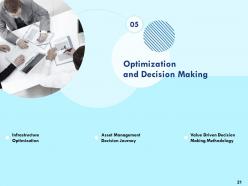
Slide 21: This slide depicts Optimization and Decision Making.
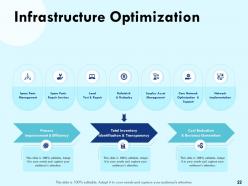
Slide 22: This slide shows Infrastructure Optimization.
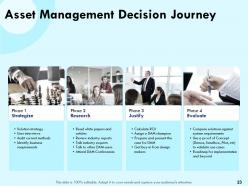
Slide 23: This slide shows Risk Assessment and Deterioration modelling.
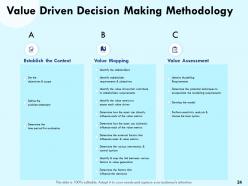
Slide 24: This slide presents Value Driven Decision Making Methodology.
Slide 25: This slide shows Performance and Cost Functions
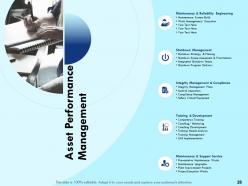
Slide 26: This slide displays Asset Performance Management.
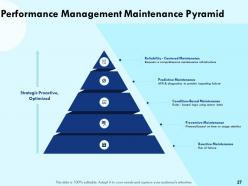
Slide 27: This slide shows Performance Management Maintenance Pyramid.
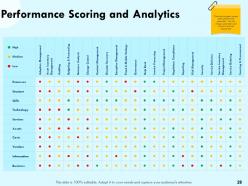
Slide 28: This slide includes various asset performance parameter. You can change parameters and scores to suit your requirement.
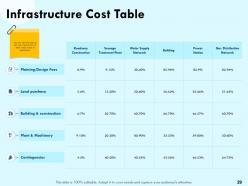
Slide 29: This slide presents Infrastructure Cost Table. You can edit this slide as per your requirement to show major areas of expenditure.
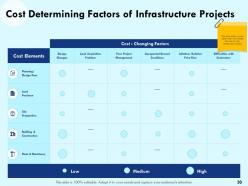
Slide 30: This slide shows various factors that may change the cost of your infrastructure project.
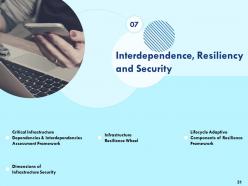
Slide 31: This slide shows Critical Infrastructure Dependencies & Interdependencies Assessment Framework
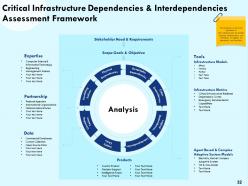
Slide 32: This slide depicts Critical Infrastructure Dependencies & Interdependencies Assessment Framework
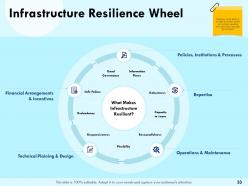
Slide 33: This slide showcases Infrastructure Resilience Wheel.
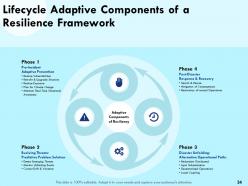
Slide 34: This slide shows Lifecycle Adaptive Components of A Resilience Framework.
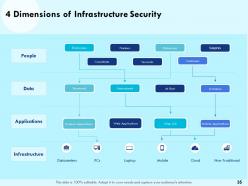
Slide 35: This slide presents 4 Dimensions of Infrastructure Security.
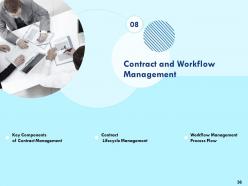
Slide 36: This slide displays Contract and Workflow Management.
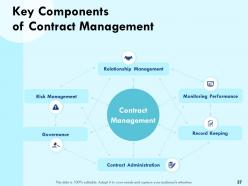
Slide 37: This slide shows Key Components of Contract Management
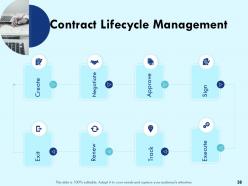
Slide 38: This slide shows Contract Lifecycle Management
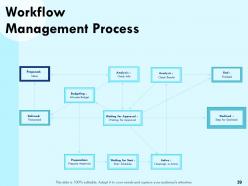
Slide 39: This slide depicts Workflow Management Process.
Slide 40: This slide presents Commissioning New Facilities.
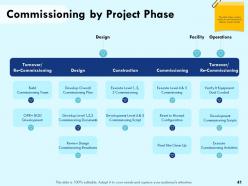
Slide 41: This slide shows various levels of commissioning at different project phases
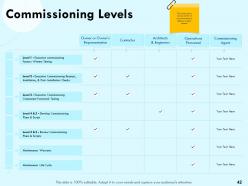
Slide 42: This slide depicts Commissioning Levels
Slide 43: This slide shows Capital Budgeting.
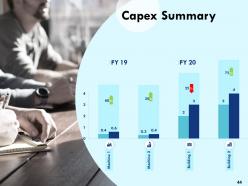
Slide 44: This slide presents Capex Summary.
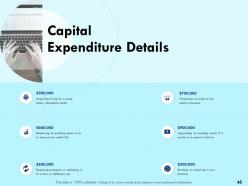
Slide 45: This slide presents Capital Expenditure Details.
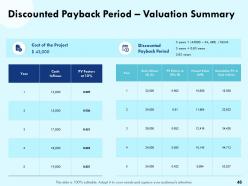
Slide 46: This slide showcases Discounted Payback Period – Valuation Summary
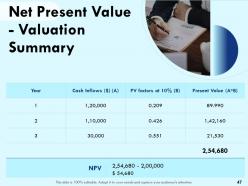
Slide 47: This slide presents Net Present Value - Valuation Summary
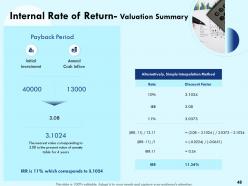
Slide 48: This slide showcases Internal Rate of Return - Valuation Summary
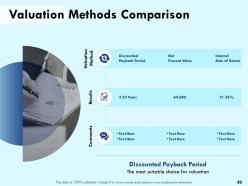
Slide 49: This slide depicts Valuation Methods Comparison
Slide 50: This slide displays KPI Metrics and Dashboard.
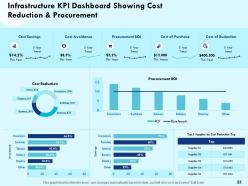
Slide 51: This slide depicts Infrastructure KPI Dashboard Showing Cost Reduction & Procurement
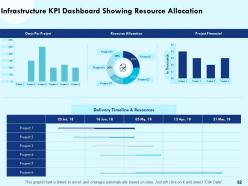
Slide 52: This slide shows Infrastructure KPI Dashboard Showing Resource Allocation
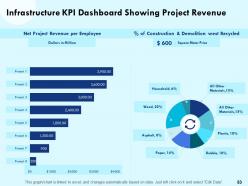
Slide 53: This slide presents Infrastructure KPI Dashboard Showing Project Revenue
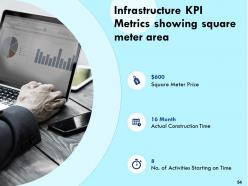
Slide 54: This slide depicts Infrastructure KPI Metrics Showing Square Meter Area.
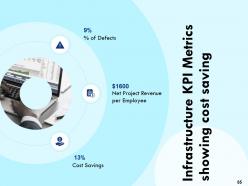
Slide 55: This slide shows Infrastructure KPI Metrics Showing Cost Saving
Slide 56: This is Example of Business Operations Analysis Icons Slide
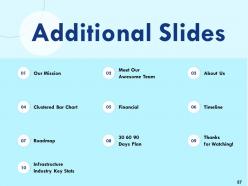
Slide 57: This slide is titled as Additional Slides for moving forward.
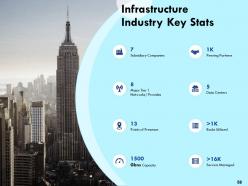
Slide 58: This slide shows Infrastructure Industry Key Stats.
Slide 59: This slide displays Mission, Vision and Goals of the Company.
Slide 60: This is Our team slide with Names and Designations.
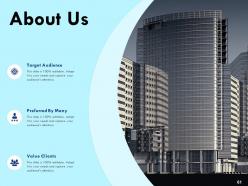
Slide 61: This is About us slide to showcase Company specifications.
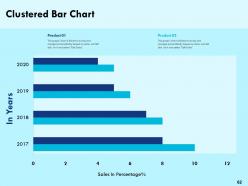
Slide 62: This slide shows Clustered bar chart for Comparison of products.
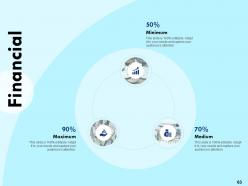
Slide 63: This is Financial slide.
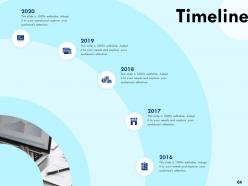
Slide 64: This slide shows Timeline process.
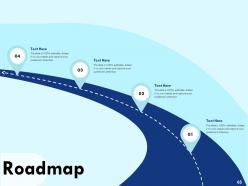
Slide 65: This slide displays Roadmap process.
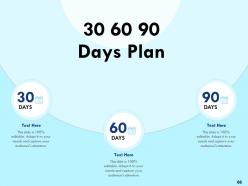
Slide 66: This is 30 60 90 Days Plan slide.
Slide 67: This is Thank you slide with Contact details.
Example of business operations analysis powerpoint presentation slides with all 67 slides:
Use our Example Of Business Operations Analysis Powerpoint Presentation Slides to effectively help you save your valuable time. They are readymade to fit into any presentation structure.





FAQs for Example of business operations analysis
Key performance indicators for business operations efficiency include operational cost ratios, cycle times, resource utilization rates, quality metrics, and customer satisfaction scores. These KPIs enable organizations to streamline processes, minimize waste, and enhance productivity across departments like manufacturing, logistics, and customer service, ultimately delivering improved profitability and competitive advantage.
Technology and automation improve operational workflows by streamlining repetitive tasks, enhancing data accuracy, and accelerating decision-making processes across organizations. Through AI-powered analytics, robotic process automation, and integrated digital platforms, companies in manufacturing, healthcare, and financial services minimize manual errors, reduce processing times, and optimize resource allocation, ultimately delivering improved efficiency and competitive advantage.
Data analytics plays a crucial role in identifying operational bottlenecks by analyzing workflow patterns, resource utilization rates, performance metrics, and process cycle times across different departments. Through predictive modeling and real-time monitoring, organizations streamline manufacturing processes, optimize supply chains, and enhance customer service delivery, ultimately reducing costs and improving operational efficiency.
Businesses measure operational improvement ROI by comparing cost savings, efficiency gains, and revenue increases against implementation investments, using metrics like productivity ratios, cycle time reductions, and customer satisfaction scores. Through benchmarking tools and performance dashboards, organizations track labor cost decreases, faster processing times, and improved quality metrics, ultimately delivering measurable financial returns and competitive operational advantages.
Companies should conduct operational audits by defining scope and objectives, mapping current processes, analyzing performance metrics, identifying inefficiencies and bottlenecks, and benchmarking against industry standards. Through systematic evaluation of workflows, technology systems, and resource allocation, organizations streamline operations, reduce costs, and enhance productivity, with many finding that comprehensive audits reveal previously hidden opportunities for competitive advantage.
Stakeholder feedback enhances operational performance analysis by providing diverse perspectives on process effectiveness, identifying blind spots in current metrics, and revealing customer pain points that internal teams might miss. Through regular surveys, focus groups, and feedback sessions, organizations can align operational improvements with actual stakeholder needs, ultimately delivering better service quality and competitive advantage.
Common pitfalls in business operations analysis include insufficient data collection, focusing on symptoms rather than root causes, ignoring stakeholder input, and failing to consider implementation feasibility. These challenges can be avoided by establishing comprehensive data gathering frameworks, conducting thorough process mapping, engaging cross-functional teams throughout the analysis, and developing realistic improvement roadmaps, ultimately delivering more accurate insights and sustainable operational enhancements.
Lean and Six Sigma methodologies optimize operations by eliminating waste, reducing variation, and streamlining processes through data-driven analysis, value stream mapping, and continuous improvement cycles. Manufacturing companies, healthcare systems, and financial services increasingly combine these approaches to achieve faster cycle times, lower defect rates, and enhanced customer satisfaction, ultimately delivering significant cost reductions and competitive advantage.
Best practices for aligning operations analysis with strategic business goals include establishing clear KPI frameworks, conducting regular cross-functional reviews, implementing data-driven decision processes, and creating feedback loops between operational and strategic teams. These approaches streamline resource allocation, enhance performance visibility, and accelerate strategic execution, with many organizations finding that integrated analysis delivers measurable competitive advantage.
Supply chain management significantly influences business operations efficiency by streamlining procurement processes, reducing inventory costs, and accelerating product delivery timelines. Through strategic supplier relationships and automated logistics systems, organizations enhance resource allocation, minimize operational bottlenecks, and improve customer satisfaction, with many manufacturing and retail companies finding that optimized supply chains ultimately deliver competitive advantage and measurable cost reductions.
Employee engagement significantly impacts operational effectiveness through increased productivity, reduced turnover, enhanced quality output, improved customer service, and greater innovation. Engaged employees in sectors like retail and manufacturing demonstrate higher efficiency rates, lower absenteeism, and stronger collaboration, while also driving cost reductions and delivering superior customer experiences that ultimately provide competitive advantage.
Regulatory compliance requirements significantly shape business operations analysis by mandating comprehensive documentation, systematic risk assessments, and standardized reporting processes across all operational functions. These requirements enable organizations to identify inefficiencies, strengthen internal controls, and enhance transparency, with many finding that compliance-driven analysis ultimately delivers improved operational resilience and competitive advantage.
Leaders should ask about trend patterns, variance explanations, resource utilization rates, bottleneck identification, and performance benchmarks against industry standards. These questions enable organizations to uncover operational inefficiencies, identify improvement opportunities, and make data-driven decisions, with many companies finding that systematic questioning reveals cost reduction opportunities and competitive advantages previously hidden in standard reporting.
Businesses leverage competitor analysis by examining rivals' supply chain efficiency, technology adoption, pricing strategies, customer service approaches, and market positioning to identify operational gaps and opportunities. Through benchmarking competitor performance metrics, companies streamline processes, adopt innovative technologies, and optimize resource allocation, ultimately delivering enhanced operational efficiency and competitive advantage in increasingly dynamic markets.
Emerging technologies transforming business operations analysis include artificial intelligence, machine learning algorithms, robotic process automation, advanced analytics platforms, and real-time data visualization tools. These technologies streamline operations by automating routine tasks, predicting operational bottlenecks, and delivering actionable insights, with manufacturing and financial services organizations finding significantly enhanced efficiency and reduced operational costs.
-
Perfect template with attractive color combination.
-
Best Representation of topics, really appreciable.
-
Use of icon with content is very relateable, informative and appealing.
-
Good research work and creative work done on every template.