


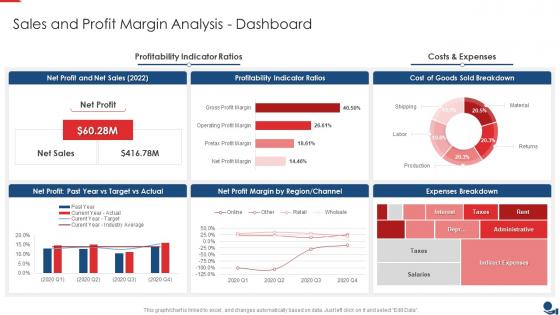
Finance And Accounting Sales And Profit Margin Analysis Dashboard




Try Before you Buy Download Free Sample Product
 Impress Your
 Audience
 100%
100% Editable
 Save Hours
 of Time


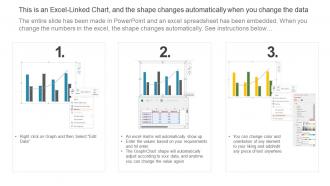
This graph or chart is linked to excel, and changes automatically based on data. Just left click on it and select Edit Data.
People who downloaded this PowerPoint presentation also viewed the following :
Finance And Accounting Sales And Profit Margin Analysis Dashboard with all 7 slides:
Use our Finance And Accounting Sales And Profit Margin Analysis Dashboard to effectively help you save your valuable time. They are readymade to fit into any presentation structure.





FAQs for Finance And Accounting Sales And Profit
Gross profit margin measures revenue minus cost of goods sold, while net profit margin accounts for all expenses including operating costs, taxes, and interest. Gross margin helps retailers and manufacturers assess production efficiency, whereas net margin provides investors and stakeholders with complete profitability insights, ultimately delivering comprehensive financial transparency for strategic decision-making.
Fluctuating costs can significantly distort profit margin analysis by creating inconsistent baseline measurements, making trend identification challenging, and potentially masking underlying operational inefficiencies or improvements. Through dynamic cost modeling and rolling averages, organizations can better navigate these variations, with many retail and manufacturing companies finding that quarterly adjustments and scenario planning deliver more accurate forecasting and strategic decision-making capabilities.
Industry benchmarking provides essential context for profit margin assessment by comparing company performance against sector averages, top quartile performers, and competitive standards. Through benchmarking analysis, organizations identify performance gaps, set realistic targets, and uncover optimization opportunities, with many finding that systematic comparison against industry leaders reveals strategic insights that drive improved profitability and competitive positioning.
Fixed costs remain constant regardless of production volume, while variable costs fluctuate with output levels, creating different impacts on profit margins at various sales volumes. Higher fixed costs require greater sales volumes to achieve profitability, but once covered, additional sales significantly boost margins, whereas high variable costs maintain consistent margin percentages but limit scalability advantages.
Common strategies to improve profit margins include cost reduction through operational efficiency, pricing optimization, product mix enhancement, automation implementation, and supplier negotiation improvements. These approaches streamline operations by minimizing waste, maximizing high-margin offerings, and leveraging technology for scalability, with many organizations finding that strategic combinations of these methods ultimately deliver sustainable competitive advantage and enhanced financial performance.
Businesses identify inefficiencies through profit margin analysis by examining gross, operating, and net margins across product lines, departments, and time periods to pinpoint underperforming areas. This analysis reveals cost structure problems, pricing misalignments, and operational bottlenecks, with many organizations finding that systematic margin reviews enable targeted improvements, streamlined operations, and enhanced profitability.
Profit margin serves as a critical foundation for pricing strategies by determining minimum viable price points, ensuring sustainable profitability, and enabling competitive positioning across different market segments. Strategic margin analysis allows businesses to optimize pricing flexibility, balance volume versus profitability trade-offs, and adapt to market conditions, with many organizations finding that data-driven margin targets ultimately deliver enhanced revenue optimization and long-term financial sustainability.
Companies use profit margin data to evaluate investment opportunities by comparing returns across different projects, identifying high-performing business segments, and assessing resource allocation efficiency. Through margin analysis, organizations can prioritize investments in profitable product lines, streamline underperforming operations, and benchmark against industry standards, ultimately delivering strategic growth and competitive advantage in increasingly complex markets.
Profit margin analysis limitations include inconsistent accounting methods, seasonal fluctuations, one-time expenses, industry comparison challenges, and overlooking operational context. While these constraints can obscure true performance trends, businesses increasingly combine margin analysis with cash flow assessments, competitive benchmarking, and operational metrics, ultimately delivering more comprehensive financial insights and strategic decision-making capabilities.
Profit margin directly reflects business profitability by measuring how much profit a company generates from each dollar of revenue through efficient cost management, pricing strategies, and operational optimization. Higher profit margins indicate stronger profitability and competitive positioning, with companies across retail, manufacturing, and services finding that improved margins enhance cash flow, support growth investments, and ultimately deliver sustainable competitive advantage in increasingly challenging markets.
Tools for effective profit margin analysis include Excel with advanced formulas, QuickBooks for integrated financial tracking, Tableau for data visualization, Power BI for comprehensive dashboards, and specialized software like ProfitCents or Sage Intacct. These platforms streamline data collection, automate calculations, and generate real-time reports, with many businesses finding that integrated solutions enhance accuracy while delivering faster insights for strategic decision-making.
Seasonal variability impacts profit margin calculations by creating fluctuations in revenue, costs, and operational efficiency throughout different periods, requiring businesses to analyze margins quarterly or monthly rather than annually. Retail companies, hospitality sectors, and agricultural businesses often experience significant seasonal swings, with many organizations finding that tracking rolling averages and seasonal adjustments delivers more accurate profitability insights and strategic planning capabilities.
Profit margin analysis informs product development by identifying high-margin opportunities, revealing cost optimization areas, guiding pricing strategies, and highlighting resource allocation priorities. Through detailed margin evaluation, companies can streamline development focus toward profitable segments, enhance feature sets that justify premium pricing, and ultimately deliver products that balance market appeal with sustainable profitability across diverse customer segments.
Businesses should consider transparency expectations, stakeholder confidence levels, competitive positioning perceptions, and investment attractiveness when communicating profit margins. While higher margins can signal efficiency and market strength, they may also raise pricing concerns among customers, with many organizations finding that balanced communication emphasizing value delivery and reinvestment strategies maintains stakeholder trust while demonstrating competitive advantage.
Market demand fluctuations significantly impact profit margins through pricing power, volume effects, and operational efficiency adjustments. During high demand periods, companies typically achieve higher margins through premium pricing and economies of scale, while demand declines often compress margins as businesses reduce prices and absorb fixed costs across lower volumes, ultimately requiring strategic pivots to maintain profitability.
-
SlideTeam is a great place for PPT templates. They have many templates on a single topic. It has made my life a lot easier.
-
The designs by SlideTeam are honestly the best I have seen so far. Will be definitely coming back for more.