


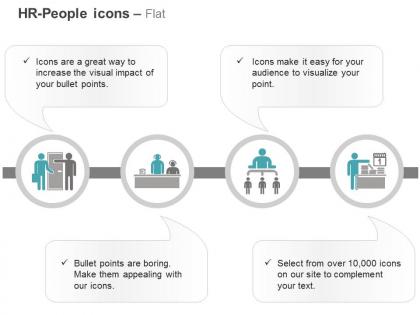
Flow chart for business networking ppt icons graphics




Try Before you Buy Download Free Sample Product
 Impress Your
 Audience
 100%
100% Editable
 Save Hours
 of Time


This creative and innovative presentation slide has been crafted by our team of professional and experienced designers. Use flow chart for business networking PPT icons graphics for a magnificent experience with your business and human resource related presentations. Graphic of flowchart and network has been used to craft this PowerPoint template diagram. This icon template contains the concept of business networking. This PPT slide is useful for students and business persons for an impactful impression. This PowerPoint slide allows you to communicate with relevant stakeholders, our impressive design which has a visual representation of how you can move step by step for progressive target achievement and business expansion. Establish your credentials with the flow chart scheme. We are here to help you gratify and enroll your audience with our pre-designed product. This PPT Template is conceptualized on covering up the company's communication and networking strategies with an objective of displaying the motive of the presentation in a clear cut way. Our Flow Chart For Business Networking Ppt Icons Graphics encourage cordial conduct. They help avoid heated debates.
People who downloaded this PowerPoint presentation also viewed the following :
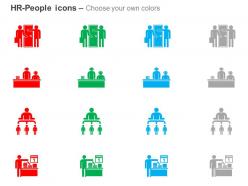
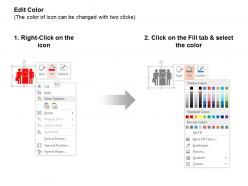
Flow chart for business networking ppt icons graphics with all 4 slides:
Choose from an array of available Flow Chart For Business Networking Ppt Icons Graphics. Their excellent facilities are bound to fascinate you.
FAQs for Flow chart for business networking
A business networking flow chart should include goal identification, target audience research, relationship mapping, engagement strategies, value proposition development, and follow-up systems. These components work together by establishing clear networking objectives, identifying key industry connections, and creating systematic touchpoint schedules, with many professionals finding that structured networking approaches ultimately deliver stronger business relationships and measurable partnership opportunities.
A flow chart can map the entrepreneurial networking journey through sequential stages like identifying target contacts, initial outreach, relationship building, value exchange, and follow-up activities. By visualizing decision points, alternative pathways, and feedback loops, entrepreneurs can systematically approach networking opportunities, track relationship progression, and ultimately build stronger professional connections that drive business growth and strategic partnerships.
Common pitfalls include overcomplicating the process with excessive steps, failing to define clear networking objectives, neglecting to identify target audience segments, and omitting measurable outcomes. These oversights can derail strategic networking efforts by creating confusion rather than clarity, with many organizations finding that simplified, goal-oriented flowcharts enhance relationship-building efficiency and deliver stronger business connections.
Flow charts enhance understanding of complex networking relationships by visualizing connection hierarchies, mapping communication pathways, identifying key decision points, and clarifying interdependencies between stakeholders. Through strategic visual mapping, organizations streamline relationship management, accelerate partnership development, and optimize resource allocation across networks, with many companies finding that clear relationship visualization ultimately delivers improved collaboration efficiency and stronger strategic partnerships.
Flow charts enable strategic networking by mapping industry hierarchies, identifying key decision-makers, tracking referral pathways, and visualizing relationship intersections across organizations. Through systematic relationship mapping, professionals can streamline their outreach efforts, prioritize high-value connections, and accelerate business development, with many finding that structured networking approaches deliver faster introductions and stronger partnership opportunities.
Feedback enables continuous refinement of business networking flow charts by identifying inefficiencies, unclear decision points, missed opportunities, and bottlenecks in relationship-building processes. Through stakeholder input from sales teams, relationship managers, and networking participants, organizations can streamline connection pathways, enhance follow-up sequences, and optimize conversion rates, ultimately delivering more strategic networking outcomes and stronger business relationships.
Color coding in flow charts enhances networking presentations by categorizing different processes, stakeholders, and decision points, making complex business relationships immediately recognizable. This visual strategy streamlines audience comprehension, reduces cognitive load during presentations, and enables faster decision-making, with many organizations finding that strategic color implementation increases audience retention and accelerates partnership discussions.
Professional flowchart tools include Microsoft Visio, Lucidchart, Draw.io, Creately, and SmartDraw, each offering templates specifically designed for business networking processes. These platforms streamline diagram creation through drag-and-drop functionality, collaborative features, and integration capabilities, with many organizations finding that cloud-based solutions like Lucidchart enhance team coordination while delivering professional presentations.
Flow charts assist in tracking networking connections by mapping relationship pathways, documenting interaction histories, measuring connection quality, and visualizing referral chains. Through structured visual frameworks, organizations can monitor relationship development stages, identify high-value connections, and track conversion rates from initial contact to business outcomes, ultimately enabling strategic relationship management and maximizing networking ROI across professional networks.
Networking flow chart metrics should include contact acquisition rates, follow-up response percentages, relationship conversion ratios, referral generation numbers, and revenue attribution tracking. These measurement points enable organizations to streamline their networking strategies by identifying high-value connections, optimizing engagement approaches, and quantifying relationship ROI, ultimately delivering measurable business growth and competitive advantage.
Digital flow charts prove more beneficial for networking when managing large-scale connections, real-time updates, remote collaboration, and data integration across multiple platforms. These digital tools streamline relationship mapping by enabling instant modifications, searchable databases, and automated contact tracking, with many sales teams and business development professionals finding that digital formats ultimately deliver faster relationship insights and scalable networking strategies.
Flow charts facilitate communication among team members by visualizing complex networking processes, standardizing workflows, and eliminating ambiguity in collaborative projects. These visual tools enable teams to streamline decision-making, enhance cross-departmental coordination, and accelerate project timelines, with many organizations finding that structured visual communication ultimately delivers improved transparency and more efficient resource allocation across networking initiatives.
Companies like Salesforce use flow charts to map customer acquisition pathways, while networking organizations such as BNI employ visual relationship mapping to track referral chains and member connections. These businesses streamline their networking processes by visualizing touchpoints, identifying high-value connections, and optimizing relationship-building strategies, ultimately delivering measurable growth in partnership opportunities and revenue generation.
Adapting flow charts for networking audiences requires adjusting complexity levels, terminology, and focus points based on stakeholder expertise and interests. Start with technical details for specialists while emphasizing outcomes for executives, with many professionals finding that tailored visualizations enhance engagement, streamline conversations, and ultimately deliver clearer communication and stronger business connections across diverse networking environments.
Best practices for presenting flow charts during networking meetings include keeping visuals simple and clear, focusing on key decision points, using consistent symbols and colors, and preparing concise explanations for each pathway. These approaches enhance professional credibility by demonstrating organized thinking, streamlining complex processes for diverse audiences, and facilitating meaningful conversations, with many networking professionals finding that well-designed flow charts serve as powerful conversation starters and relationship-building tools.
-
Much better than the original! Thanks for the quick turnaround.
-
Appreciate the research and its presentable format.