


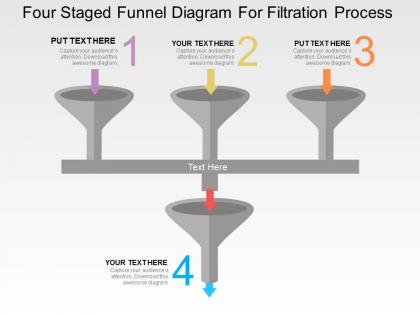
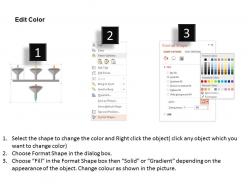
Four staged funnel diagram for filteration process flat powerpoint design




Try Before you Buy Download Free Sample Product
 Impress Your
 Audience
 100%
100% Editable
 Save Hours
 of Time


Are you an educator and looking for a powerful template PowerPoint for your students? You may be a professor and are searching for PowerPoint slide inspiration so that your pupils are able to grasp completely what you are trying to teach. You might be a businessman and want to explain the intricacies of a business model or a project management strategy. Whatever your line of work, you will always require a medium that delivers your agenda to your employees, team members or colleagues in a concise way. Our four staged funnel diagram for filtration process flat Presentation deck slide is the way forward. Never let them lose sight of your objective with artistic PPT diagrams and aptly positioned PPT icons. Funnel shaped PPT infographics are the centerpiece of this PowerPoint layout. All elements of PPT example slides are intelligently positioned to deliver to your audience a well-rounded presentation. Employ this presentation PowerPoint example for a hassle free and straightforward presentation. Halt any decline with our Four Staged Funnel Diagram For Filteration Process Flat Powerpoint Design. They will bring you back on course.
People who downloaded this PowerPoint presentation also viewed the following :
Four staged funnel diagram for filteration process flat powerpoint design with all 4 slides:
Be assured of great architecture with our Four Staged Funnel Diagram For Filteration Process Flat Powerpoint Design. They are good for building your edifice.
FAQs for Four staged funnel diagram for filteration process
Key components of a filtration process funnel diagram include input stages, filtering criteria, decision points, output channels, and rejection pathways. These elements streamline complex sorting processes by visualizing data flow, identifying bottlenecks, and tracking conversion rates, with many organizations finding that clear funnel mapping enhances operational efficiency and decision-making accuracy.
Filtration processes vary significantly across industries, with pharmaceuticals requiring sterile filtration for drug purity, membrane bioreactors for biotechnology, and HEPA systems for cleanrooms, while water treatment utilizes sand filtration, reverse osmosis, and chemical coagulation. These specialized approaches enable pharmaceutical companies to meet FDA compliance standards and water treatment facilities to deliver safe drinking water, ultimately ensuring product quality and public health while maintaining operational efficiency in increasingly regulated environments.
Common filtration materials include activated carbon, ceramic membranes, sand, synthetic polymers, and HEPA fibers, each requiring specific diagram representations based on their filtration mechanisms. These materials affect diagram design by determining flow patterns, retention stages, and pressure requirements, with water treatment facilities and pharmaceutical manufacturers finding that material-specific visual documentation enhances operational efficiency and regulatory compliance.
A filtration process funnel diagram enhances understanding of operational efficiency by visualizing workflow stages, identifying bottlenecks, mapping resource allocation points, and highlighting decision-making checkpoints throughout the system. Through clear visual representation, organizations streamline quality control processes, reduce waste elimination timeframes, and optimize throughput rates, with many manufacturing and pharmaceutical companies finding that these diagrams ultimately deliver faster production cycles and improved operational transparency.
Pressure accelerates the filtration process by forcing liquid through filter media more rapidly, overcoming resistance and reducing processing time significantly. In industrial applications like pharmaceutical manufacturing, water treatment facilities, and chemical processing plants, controlled pressure systems enable consistent flow rates, minimize clogging issues, and ultimately deliver faster production cycles while maintaining filtration quality and operational efficiency.
Different filtration methods can be visually represented using distinct icons, color coding, and labeled sections within each funnel stage, such as mechanical filters with gear symbols, biological processes with organism icons, and chemical treatments with molecule graphics. This approach enables organizations across manufacturing, water treatment, and pharmaceutical industries to streamline process documentation, enhance team understanding, and ultimately deliver clearer operational workflows while maintaining comprehensive technical accuracy.
Important metrics include filtration efficiency percentages, particle size reduction ratios, flow rates, pressure differentials, and contaminant removal rates at each stage. These measurements enable organizations to optimize their filtration processes by identifying bottlenecks, monitoring performance consistency, and ensuring quality standards, with manufacturing and water treatment facilities finding that systematic tracking ultimately delivers improved operational efficiency and regulatory compliance.
Optimal flow rates in filtration process funnel diagrams are determined by analyzing particle size distribution, filter media specifications, pressure differentials, and desired separation efficiency at each stage. Through systematic testing and modeling, organizations in pharmaceuticals, water treatment, and chemical processing balance throughput with filtration quality, ultimately delivering consistent product specifications while minimizing operational costs and maximizing system longevity.
Data visualization enhances filtration process diagrams by transforming complex technical information into clear, interactive visual formats through color coding, flow animations, real-time monitoring dashboards, and layered data representation. These approaches enable engineers and operators to quickly identify bottlenecks, track efficiency metrics, and optimize performance across manufacturing, water treatment, and pharmaceutical sectors, ultimately delivering faster decision-making and improved operational outcomes.
Common misconceptions about filtration include believing it's purely linear, that all criteria are equally important, that rejected elements are worthless, and that the process happens instantly without iteration. A well-designed funnel diagram clarifies these by visually showing the multi-stage nature, varying filter sizes, feedback loops, and retention points, with many organizations finding that clear visualization helps teams understand qualification criteria, timing expectations, and the strategic value of systematic filtering approaches.
Higher fluid viscosity requires filtration funnel modifications including larger funnel diameters, extended stem lengths, coarser filter media, and increased surface areas to maintain adequate flow rates. These design adjustments enable laboratories and manufacturing facilities to process thicker solutions effectively, with industries like pharmaceuticals and chemical processing finding that optimized funnel specifications significantly reduce processing times while maintaining filtration quality.
**INPUT**: What is the significance of the inlet and outlet points in a filtration process funnel diagram? **OUTPUT**: Inlet and outlet points represent critical control stages where raw materials enter and refined products exit, defining the filtration system's operational boundaries and measurement parameters. These points enable organizations to monitor flow rates, quality metrics, and system efficiency, with manufacturing facilities and water treatment plants finding that strategic inlet-outlet placement ultimately delivers enhanced process control and operational transparency. *[Word count: 58]*
Color coding in filtration diagrams involves assigning distinct colors to represent different stages, such as red for raw input, yellow for preliminary filtration, blue for secondary treatment, and green for final purified output. This visual approach streamlines process understanding by enabling quick stage identification, enhancing team communication during presentations, and facilitating easier troubleshooting, with many manufacturing and water treatment facilities finding that color-coded systems significantly improve operational efficiency and training outcomes.
Digital tools enhance filtration process funnel diagram creation through automated data visualization, real-time collaboration features, interactive elements, template libraries, and seamless integration with analytics platforms. These technologies streamline diagram development by enabling drag-and-drop functionality, instant updates from live data sources, and collaborative editing capabilities, with many engineering teams and manufacturing organizations finding that digital solutions significantly reduce design time while improving accuracy and stakeholder communication.
Understanding filtration processes enables industrial sustainability by optimizing resource utilization, reducing waste generation, and minimizing environmental impact through efficient separation techniques. Manufacturing facilities, chemical plants, and water treatment operations leverage advanced filtration to recover valuable materials, extend equipment lifespan, and meet regulatory standards, ultimately delivering cost savings and competitive advantage in increasingly environmentally-conscious markets.
-
Professional and unique presentations.
-
Nice and innovative design.