


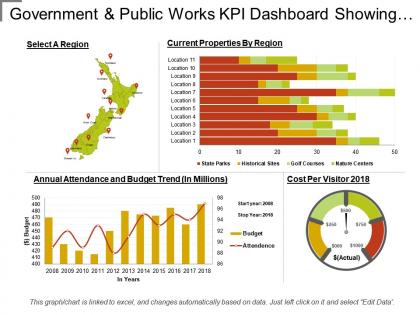
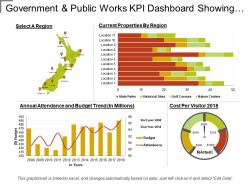
Government and public works kpi dashboard showing annual attendance and budget




Try Before you Buy Download Free Sample Product
 Impress Your
 Audience
 100%
100% Editable
 Save Hours
 of Time


Allow for eccentricities with our Government And Public Works Kpi Dashboard Showing Annual Attendance And Budget. They enjoy catering for them.
People who downloaded this PowerPoint presentation also viewed the following :
Government and public works kpi dashboard showing annual attendance and budget with all 6 slides:
Goals get clearly defined with our Government And Public Works Kpi Dashboard Showing Annual Attendance And Budget. Every element acquires fine focus.



FAQs for Government and public works kpi dashboard showing annual
Effective government KPIs include service delivery time, cost per service transaction, citizen satisfaction scores, digital service adoption rates, and regulatory compliance percentages. These indicators enhance accountability by streamlining operations, reducing bureaucratic delays, and improving citizen experiences, with many public agencies finding that strategic KPI implementation ultimately delivers measurable improvements in efficiency and transparency.
Government agencies can align their KPIs with strategic goals by establishing cascading performance frameworks, conducting regular stakeholder consultations, and implementing cross-departmental coordination mechanisms. Through strategic mapping processes, agencies like public health departments and transportation bureaus create measurable targets that directly support broader objectives such as economic development or citizen welfare, while ensuring accountability and transparent resource allocation across all governmental levels.
Citizen feedback metrics serve as critical input for developing responsive public sector KPIs, measuring satisfaction levels, service accessibility, response times, and overall trust in government institutions. These metrics enable agencies to align performance indicators with actual citizen needs, ultimately improving service delivery and accountability, with many municipalities finding that feedback-driven KPIs enhance transparency and citizen engagement significantly.
Data analytics enhances government KPI accuracy by enabling real-time data collection, predictive modeling, and cross-departmental integration, while eliminating manual reporting errors and data silos. Through advanced analytics platforms, agencies can track citizen satisfaction, budget efficiency, and service delivery metrics more precisely, ultimately delivering evidence-based policy decisions and improved public services.
Governments face challenges including fragmented data systems across departments, inconsistent measurement standards, limited technical infrastructure, and resource constraints for data collection. These obstacles often result in delayed reporting, incomplete datasets, and difficulty comparing performance across agencies, with many public sector organizations finding that strategic investment in integrated data platforms ultimately enhances transparency and citizen services.
Transparency in government KPIs builds public trust by providing clear visibility into performance metrics, resource allocation, service delivery outcomes, and accountability measures. When citizens can access real-time data on budget utilization, project timelines, and service quality, they develop greater confidence in governmental effectiveness, while enabling informed civic participation and ultimately strengthening democratic engagement.
KPIs drive government innovation by measuring digital transformation progress, citizen satisfaction scores, process automation rates, and service delivery times. Through performance tracking, agencies identify improvement opportunities, streamline operations, and enhance public experiences, with many departments finding that innovation-focused metrics accelerate modernization efforts and deliver measurable efficiency gains across diverse service areas.
Governments can balance quantitative and qualitative KPIs by integrating measurable metrics like budget efficiency, service delivery times, and citizen satisfaction scores with qualitative assessments including stakeholder feedback, policy impact evaluations, and community engagement levels. This strategic combination enables comprehensive performance measurement across departments like healthcare, education, and public safety, ultimately delivering improved citizen experiences and more effective resource allocation.
Successful government KPI frameworks include Singapore's Whole-of-Government performance system, the UK's Government Digital Service metrics, Canada's Policy on Results tracking, Australia's Performance Framework, and New Zealand's Living Standards Dashboard. These comprehensive systems enhance transparency, resource allocation, and citizen services by measuring digital transformation, economic outcomes, and social progress, with many countries finding that data-driven governance ultimately delivers improved public sector efficiency and accountability.
External factors significantly influence government KPIs by affecting revenue collection, unemployment rates, healthcare demands, infrastructure needs, and public service capacity. Economic downturns, for example, reduce tax revenues while increasing social service requirements, forcing agencies to recalibrate performance targets, with many governments finding that adaptive KPI frameworks enable more resilient planning and resource allocation during volatile periods.
Ensuring KPI relevance requires regular review cycles, stakeholder feedback integration, performance benchmarking against similar agencies, and alignment assessments with evolving policy priorities. Government organizations should establish quarterly evaluation processes, incorporate citizen satisfaction metrics, and adapt measurements based on changing demographics, technology capabilities, and regulatory requirements, ultimately delivering responsive public services that meet contemporary community needs.
Governments can effectively communicate KPIs through transparent dashboards, regular public reports, simplified visual presentations, community forums, and accessible digital platforms. These approaches enhance accountability by translating complex performance metrics into understandable formats, with many municipalities finding that interactive websites and quarterly town halls significantly improve citizen engagement and trust while demonstrating measurable progress on public priorities.
Governments can benchmark KPIs through peer comparisons with similar-sized jurisdictions, industry standard adoption from sectors like healthcare and finance, citizen satisfaction surveys, and third-party performance audits. These approaches enable public agencies to identify performance gaps, streamline service delivery, and enhance operational efficiency, with many municipalities finding that systematic benchmarking ultimately delivers improved citizen experiences and competitive resource allocation.
Community engagement significantly influences government KPI development by providing citizen feedback, identifying priority areas, ensuring accountability measures reflect public needs, and validating performance metrics through lived experiences. This collaborative approach enhances transparency, builds public trust, and enables more responsive governance, with many municipalities finding that citizen-informed KPIs deliver better service outcomes and stronger community relationships.
Technology solutions for government KPI tracking include cloud-based analytics platforms, automated data integration systems, real-time dashboards, AI-powered reporting tools, and mobile monitoring applications. These technologies streamline operations by eliminating manual data collection, providing instant performance visibility, and enabling predictive analytics, with many government agencies finding that automated systems reduce reporting time by 60% while enhancing transparency and accountability.
-
Use of different colors is good. It's simple and attractive.
-
Awesome presentation, really professional and easy to edit.