


High medium and low icon with risk indicator




Try Before you Buy Download Free Sample Product
 Impress Your
 Audience
 100%
100% Editable
 Save Hours
 of Time


Our High Medium And Low Icon With Risk Indicator are topically designed to provide an attractive backdrop to any subject. Use them to look like a presentation pro.
People who downloaded this PowerPoint presentation also viewed the following :
Content of this Powerpoint Presentation
Description:
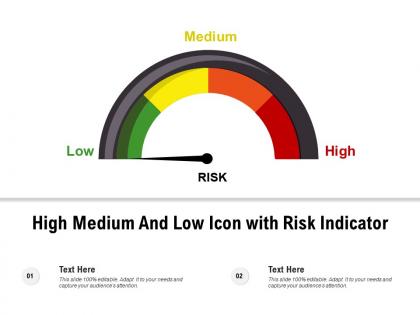
The image features a PowerPoint slide titled "High Medium And Low Icon with Risk Indicator," which displays a risk assessment gauge. The gauge's needle points to the "Low" section, indicating a current state of low risk. The gauge is colored with green, yellow, and red segments representing low, medium, and high risk, respectively.
The slide has two placeholders labeled "Text Here," indicating areas where additional information can be inserted. These could be used to describe specific risk factors or mitigation strategies relevant to the gauge's reading.
Use Cases:
This visual tool is versatile and can be applied across numerous industries for risk management and assessment:
1. Finance:
Use: Assessing investment risks.
Presenter: Financial Analyst.
Audience: Investors, portfolio managers.
2. Healthcare:
Use: Evaluating patient care risks.
Presenter: Risk Manager.
Audience: Medical staff, hospital administration.
3. Information Technology:
Use: Analyzing cybersecurity threats.
Presenter: IT Security Officer.
Audience: IT department, company executives.
4. Manufacturing:
Use: Monitoring safety in production processes.
Presenter: Safety Officer.
Audience: Factory workers, safety inspectors.
5. Insurance:
Use: Explaining risk profiles for insurance underwriting.
Presenter: Insurance Underwriter.
Audience: Clients, agents.
6. Construction:
Use: Assessing project risk at various stages.
Presenter: Project Manager.
Audience: Construction team, stakeholders.
7. Energy:
Use: Managing risks in energy production and distribution.
Presenter: Operations Manager.
Audience: Field operators, regulatory bodies.
High medium and low icon with risk indicator with all 2 slides:
Use our High Medium And Low Icon With Risk Indicator to effectively help you save your valuable time. They are readymade to fit into any presentation structure.
FAQs for High medium and low icon
Risk indicator levels in project management include probability assessments, impact severity ratings, detection timing, mitigation readiness, and stakeholder exposure metrics. These components work together by establishing clear thresholds for escalation, enabling proactive resource allocation, and streamlining decision-making processes, with many organizations finding that structured risk frameworks ultimately deliver faster project recovery and enhanced stakeholder confidence.
Organizations effectively categorize risk indicator levels by establishing clear thresholds, using quantitative metrics like probability and impact scores, implementing color-coded systems, and defining specific response protocols for each level. Through structured frameworks, companies across sectors like banking and manufacturing can prioritize resources, automate escalation processes, and ensure consistent risk assessment, ultimately delivering faster decision-making and enhanced operational resilience.
Data analytics plays a crucial role in determining risk indicator levels by processing vast datasets, identifying patterns and anomalies, and providing real-time risk assessments across multiple variables. Through advanced algorithms and machine learning models, organizations can enhance prediction accuracy, automate threat detection, and continuously calibrate their risk thresholds, ultimately delivering more precise risk management and strategic decision-making capabilities.
Risk indicator levels vary significantly across industries, with finance focusing on market volatility, credit defaults, and regulatory compliance, while healthcare emphasizes patient safety, data breaches, and clinical outcomes. These sector-specific frameworks reflect unique operational challenges, with financial institutions prioritizing fraud detection and liquidity management, and healthcare organizations concentrating on treatment effectiveness and privacy protection, ultimately delivering tailored risk management strategies.
Best practices for communicating risk indicator levels include using standardized color-coding systems, providing clear threshold definitions, delivering regular automated reports, and creating visual dashboards with trend analysis. These approaches enhance stakeholder understanding by translating complex data into actionable insights, enabling faster decision-making across departments, while organizations increasingly find that consistent communication protocols improve risk response times and strategic alignment.
Risk indicator levels integrate into decision-making processes by establishing clear thresholds for different response protocols, automating alerts when metrics exceed acceptable ranges, and providing real-time dashboards for management oversight. Through these systems, organizations in banking, healthcare, and manufacturing can prioritize resource allocation, accelerate response times, and minimize potential losses, ultimately delivering more informed strategic decisions and competitive operational advantage.
**INPUT**: What metrics should be used to evaluate the effectiveness of risk indicator levels? **OUTPUT**: Key metrics include detection accuracy, false positive rates, response time efficiency, cost-benefit ratios, and escalation frequency analysis. Financial institutions and healthcare organizations increasingly find that combining predictive accuracy with operational metrics, such as alert resolution times and resource allocation efficiency, delivers comprehensive risk management insights while minimizing unnecessary alerts and enhancing decision-making speed. [Word count: 55 words]
Organizations should reassess risk indicator levels quarterly at minimum, with more frequent reviews during periods of significant operational changes, market volatility, or regulatory updates. Many financial institutions and healthcare organizations conduct monthly assessments, while manufacturing and retail sectors often implement continuous monitoring systems that trigger automatic recalibration, ultimately ensuring indicators remain relevant and actionable for evolving business environments.
Organizations face challenges establishing risk indicator levels through data quality inconsistencies, lack of historical benchmarks, difficulty quantifying qualitative risks, and balancing sensitivity with practicality. These complexities often result in either overly conservative thresholds that generate false alerts or lenient levels that miss critical exposures, with many financial institutions and healthcare organizations finding that regular calibration and cross-functional input ultimately enhances accuracy.
Qualitative approaches rely on expert judgment, scenario analysis, and descriptive assessments to evaluate risk indicators, while quantitative methods use statistical models, numerical data, and mathematical calculations. Through qualitative analysis, organizations capture nuanced insights and contextual factors, whereas quantitative approaches deliver measurable metrics and predictive accuracy, with many financial institutions combining both methods for comprehensive risk management.
Technology significantly transforms risk indicator levels by enabling real-time data processing, predictive analytics, automated monitoring systems, and enhanced pattern recognition capabilities. Through machine learning and AI integration, financial institutions and healthcare organizations can identify emerging risks faster, adjust indicator thresholds dynamically, and ultimately deliver more accurate risk assessments while reducing false positives.
Risk indicator levels can be visualized effectively through color-coded dashboards, traffic light systems, heat maps, gauge charts, and tiered matrix displays that immediately communicate severity and urgency. These visual approaches streamline decision-making by enabling stakeholders to quickly identify critical areas, prioritize responses, and track performance trends, with many organizations finding that clear risk visualization enhances strategic planning and accelerates mitigation efforts.
Risk indicator levels serve as critical benchmarks for regulatory compliance by establishing measurable thresholds, monitoring operational boundaries, and triggering mandatory reporting protocols. These levels enable financial institutions, healthcare organizations, and manufacturing companies to demonstrate adherence to regulatory standards, automate compliance reporting, and proactively address potential violations, ultimately reducing regulatory penalties and maintaining operational licenses.
Organizations should integrate both subjective assessments and objective measures by establishing structured frameworks that combine quantifiable metrics with expert judgment, contextual analysis, and stakeholder insights. This strategic combination enables more comprehensive risk evaluation, with many financial services and healthcare institutions finding that balanced approaches deliver enhanced accuracy, reduced blind spots, and ultimately stronger risk management capabilities in increasingly complex operational environments.
Organizations can empower teams through automated alert systems, clear escalation protocols, defined response procedures, real-time dashboards, and regular training programs. These frameworks enable teams to monitor emerging threats continuously, implement immediate containment measures, and adjust strategic responses dynamically, with many financial institutions and healthcare organizations finding that empowered frontline teams deliver faster risk mitigation and enhanced operational resilience.
No Reviews