


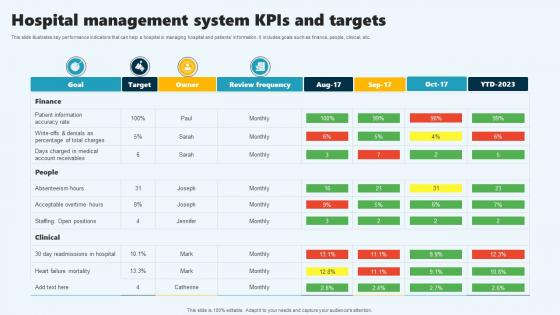
Hospital Management System Kpis And Targets




Try Before you Buy Download Free Sample Product
 Impress Your
 Audience
 100%
100% Editable
 Save Hours
 of Time


This slide illustrates key performance indicators that can help a hospital in managing hospital and patients information. It includes goals such as finance, people, clinical, etc.
People who downloaded this PowerPoint presentation also viewed the following :
Hospital Management System Kpis And Targets with all 6 slides:
Use our Hospital Management System Kpis And Targets to effectively help you save your valuable time. They are readymade to fit into any presentation structure.





FAQs for Hospital Management System
Okay so for hospital KPIs, start with patient satisfaction and readmission rates - seriously, these can tank your whole reputation if they're bad. Financial stuff matters too: bed occupancy, length of stay, cost per discharge. Then add operational things like wait times and staff ratios. Oh, and equipment utilization if you're into that. I'd stick to maybe 8-10 KPIs tops because honestly, tracking too many just creates noise. Pick ones that actually connect to what you're trying to achieve, not random metrics that look impressive on dashboards but don't help you make real decisions.
Make patient satisfaction a main KPI next to your clinical and financial stuff. HCAHPS surveys, post-discharge calls, real-time feedback - track it all monthly. Don't get hung up on the actual scores though, that's where most places mess up. What you really want is breaking it down by department and specific touchpoints like admissions or discharge. Set targets and tie them to performance reviews. The magic happens when you build dashboards showing how satisfaction connects to readmission rates and length of stay. That's your goldmine for actually improving things.
So here's the deal with hospital financial KPIs - they're what keep the lights on and determine if you can actually provide decent care. Track stuff like operating margin, cost per patient, revenue cycle efficiency, bad debt ratios. I know it sounds boring, but these metrics directly affect whether you can hire nurses or buy new equipment. When the numbers tank, it usually means something's broken operationally too - could be patient flow issues or your billing department's a mess. Check them monthly and use the data to figure out what fires to put out first.
So for tracking how efficiently your hospital's running, I'd focus on the basics first. Bed turnover time and average length of stay are solid starting points. ED throughput too - that's where bottlenecks really show up. Staff metrics matter tons, especially nurse-to-patient ratios and overtime hours. Trust me, overtime will eat your budget alive if you're not careful. Equipment utilization and surgery schedule adherence round it out. Honestly though? Pick maybe 3-4 that actually relate to your biggest pain points right now. Don't get caught up tracking every single metric - you'll go crazy.
Look at patient satisfaction scores tied to specific staff interactions - like discharge ratings or communication feedback. Those handoff metrics between shifts/departments are gold too. Honestly, some places track "time to first meaningful patient interaction" which sounds cheesy but actually shows a ton about bedside manner. Innovation stuff works great for engagement - who's submitting improvement ideas, attending training, that kind of thing. Oh, and cross-department collaboration scores are huge. I'd start with maybe 2-3 of these on top of what you're already tracking and see what patterns pop up.
Honestly, readmission rates are like your best early warning system. Track patients coming back within 30 days and you'll spot patterns fast - maybe discharge instructions suck, or certain conditions aren't getting managed right. I've seen hospitals miss obvious stuff this way. You can break it down by department or even individual doctors to see what's not working. The real trick? Use that data to fix your discharge process and follow-up care. Oh, and set up alerts when rates jump above normal - that part's huge for catching problems early.
So ALOS tracks how long patients stay from admission to discharge - it's honestly a goldmine for spotting problems. When it's high, you've probably got bottlenecks somewhere. Maybe discharges are getting delayed or departments aren't talking to each other well enough. Shorter stays usually mean you're moving people through care more smoothly, which frees up beds and keeps staff busy in the right way. The revenue side benefits too since you can admit more patients. I'd definitely break it down by department and diagnosis - that's where you'll actually see what's broken. Way more useful than just looking at hospital-wide numbers.
Start with AHRQ's Hospital Compare or CMS data - they're free and solid. Premier and Vizient have those benchmarking consortiums where hospitals pool their data anonymously, which is honestly pretty useful. Press Ganey does quarterly reports too, though they'll cost you. The trick is matching your hospital type - same size, region, patient mix, all that. Don't go crazy trying to benchmark everything right away. Pick maybe 3-5 key metrics first and see how that goes. Healthcare analytics can get overwhelming fast if you're not careful about scope.
Honestly, I'd go with something like Tableau or Power BI first - they're solid for hospital data complexity. Epic has decent reporting tools built-in if you're already using them, though they can be a pain sometimes. For real-time stuff, QlikView works well, or you could build custom dashboards that connect to your current databases. Figure out your top 5 KPIs before picking anything though. That'll save you from going in circles later. Just make sure whatever you choose plays nice with your existing systems - your IT team will thank you for it.
Wait times mess with everything - your patient satisfaction scores tank, staff gets burned out, and operational efficiency goes to hell. HCAHPS scores suffer when people sit around forever. Plus readmission rates creep up, which is annoying because it's often preventable. Your bed turnover gets screwed up too since discharge planning falls behind. Honestly, stressed staff means higher turnover, and that data always looks terrible to administration. One department running slow creates chaos everywhere else. I'd track average waits by unit first, set some realistic targets, then figure out where the actual bottlenecks are happening.
Hey! So there are four big things you should track: patient outcomes like readmission rates and infections, operational stuff (wait times, bed turnover), how productive your staff gets, and the financial side - ROI and cost per patient. That ROI calculation is honestly a pain at first, but executives eat that up. Don't forget user adoption rates though - I've seen so many places buy fancy tech that just sits there unused. Super important to get your baseline numbers before you roll anything out. Makes the before/after comparisons way more convincing when you're presenting results.
Focus on wait times and door-to-doctor metrics first - those'll show you where things get stuck. Length of stay is critical too, anything past 4 hours means your workflow's broken. Honestly, the "left without being seen" rate is probably my favorite metric because it's so telling. Patient satisfaction scores round it out nicely since they show what's actually happening from the patient side. Don't try tracking everything right away though. Pick 3-4 solid metrics and get real-time dashboards going so your team can pivot quickly when numbers start going south. Staff-to-patient ratios help explain the why behind poor performance too.
Honestly, patient safety indicators should be your starting point for any KPI dashboard. Track stuff like infection rates, med errors, falls, readmissions - the basics that actually matter. These directly hit your outcomes AND finances, so it's kind of a no-brainer. Why bother with efficiency metrics if people aren't safe, you know? They help catch issues early and keep regulators happy too. Figure out which safety metrics are most relevant for each department first. Then track them consistently and - this is key - actually DO something when the numbers look bad. Otherwise you're just collecting data for no reason.
Honestly, the key is knowing your audience first. Board members just want the big picture financial stuff in clean dashboards - they don't care about operational weeds. Department heads are the opposite though, they need details they can actually do something with. Ditch the spreadsheets if you can. Visual dashboards are so much easier to digest (learned this the hard way). Set up automated reports to save yourself the headache of manual updates every month. Regular meetings help too, but focus on trends and context. Like instead of just saying "readmission rate dropped 2%," explain that it saved around $500K annually. Makes the numbers actually mean something to people.
Oof, turnover is such a nightmare for hospitals. Patient satisfaction tanks because new staff don't know the ropes yet. Your readmission rates go up too - hard to maintain good care when experienced people keep bailing. The money side gets ugly fast with all the recruiting and training costs, plus you're constantly paying overtime to cover shifts. Safety scores usually drop since newer staff make more mistakes (which honestly makes sense). I'd say start by figuring out which departments are bleeding people the worst - that's where you'll see the biggest impact if you can actually fix the retention issues.
-
My presentations were a bit amateur before I found SlideTeam’s designs. I’ve been able to find slides for nearly every topic I’ve had to present. Thanks, Slideteam!
-
Great quality slides in rapid time.