


Hr kpi dashboard snapshot with retention and expansion




Try Before you Buy Download Free Sample Product
 Impress Your
 Audience
 100%
100% Editable
 Save Hours
 of Time


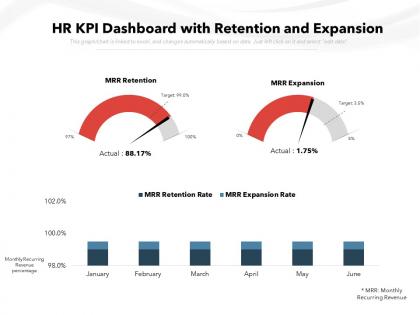
Introducing the HR KPI Dashboard With Retention And Expansion PowerPoint template to address the critical performance indicators and highlight the statistics in light of it. Use this PPT presentation to plot and display your monthly revenue retention rate. This PPT slide can help you analyze the performance of your monthly or annual subscription against the targeted percentages. With the in-built structure, study and display your varying MRRs over the period of a year. Gather your sources of additional revenue and work on retaining your loyal customers. Using the metric and the visual denotations of this PowerPoint design, build a visual representation of metrics that realign your teammates in the direction of prosperity. Pay attention to expansion revenue, downgrades, and cancels and find ways to encourage add-ons, upselling, and cross-selling. Download this PPT layout here to measure your progress today.
People who downloaded this PowerPoint presentation also viewed the following :
Hr kpi dashboard snapshot with retention and expansion with all 2 slides:
Use our HR KPI Dashboard With Retention And Expansion to effectively help you save your valuable time. They are readymade to fit into any presentation structure.
FAQs for Hr kpi dashboard snapshot with
Effective HR KPI dashboards include employee turnover rates, time-to-hire metrics, employee satisfaction scores, training completion rates, and performance review data. These components enable organizations to streamline workforce management by identifying retention challenges, accelerating recruitment processes, and enhancing employee engagement, with many companies finding that comprehensive dashboards ultimately deliver improved operational efficiency and strategic talent decisions.
An HR KPI dashboard aligns workforce performance with organizational goals by tracking metrics like productivity rates, goal completion percentages, skill development progress, and performance ratings against strategic objectives. Through real-time visibility into employee contributions, managers can identify performance gaps, redistribute resources strategically, and implement targeted interventions, ultimately ensuring individual achievements directly support broader business outcomes and competitive advantage.
Small businesses should prioritize employee turnover rates, cost-per-hire, time-to-fill positions, and employee satisfaction scores, while large corporations typically focus on diversity metrics, performance ratings, training completion rates, and succession planning indicators. These strategic combinations enable organizations to streamline talent management by addressing scale-appropriate challenges, optimizing resource allocation, and ultimately delivering enhanced operational efficiency, with many companies finding that tailored dashboards significantly improve workforce planning and competitive advantage.
Visualizations in HR KPI dashboards enhance data comprehension by transforming complex metrics into intuitive charts, graphs, and heat maps that reveal patterns, trends, and anomalies at a glance. These visual representations enable HR leaders to quickly identify talent gaps, track employee engagement scores, and monitor turnover rates across departments, ultimately streamlining strategic workforce planning and delivering faster, more informed decisions.
Employee turnover rate serves as a critical metric in HR KPI dashboards, influencing recruitment costs, workforce planning, retention strategies, and organizational stability measures. This key indicator helps HR teams identify department-specific retention challenges, benchmark against industry standards, and develop targeted interventions, ultimately enabling organizations to reduce hiring expenses while maintaining consistent talent pipelines and operational continuity.
Companies use HR KPI dashboards to enhance recruitment and retention by tracking time-to-hire, cost-per-hire, employee turnover rates, engagement scores, and performance metrics. These dashboards enable HR teams to identify bottlenecks in hiring processes, predict retention risks, and optimize compensation strategies, with many organizations finding significantly improved talent acquisition outcomes and reduced turnover costs.
Best practices for HR KPI dashboard design include clear visual hierarchy, consistent color coding, logical metric grouping, responsive layouts, and streamlined navigation pathways. These design principles enhance data accessibility by minimizing cognitive load, prioritizing critical metrics prominently, and enabling quick decision-making, with many HR teams finding that intuitive layouts significantly reduce analysis time while improving strategic workforce insights.
An HR KPI dashboard incorporates employee engagement metrics through pulse survey scores, retention rates, participation levels in company initiatives, performance ratings, and feedback sentiment analysis. These metrics enable organizations to identify engagement trends, address workplace concerns proactively, and enhance retention strategies, with many companies finding that real-time engagement tracking significantly improves employee satisfaction and productivity.
HR KPI dashboard creation relies on tools like Tableau, Power BI, SAP SuccessFactors, Workday Analytics, and Google Data Studio. These platforms streamline data visualization, automate reporting processes, and integrate multiple HR systems seamlessly, with many organizations finding that cloud-based solutions deliver real-time insights and enhanced decision-making capabilities across their workforce management strategies.
HR KPIs should be reviewed monthly for operational metrics like turnover and absenteeism, quarterly for strategic indicators such as employee engagement and training effectiveness, and annually for long-term goals. Many organizations find that automated dashboards enable real-time monitoring while scheduled reviews ensure alignment with business objectives, ultimately delivering more responsive HR strategies and improved workforce management decisions.
Organizations face challenges including data integration from multiple HR systems, ensuring data accuracy and consistency, defining relevant KPIs aligned with business objectives, and securing stakeholder buy-in across departments. While implementation complexity can be significant, many companies find that investing in proper training, establishing clear governance frameworks, and starting with core metrics ultimately delivers enhanced decision-making capabilities and strategic HR insights.
Training effectiveness can be measured through HR KPIs including completion rates, skill assessment scores, employee performance improvements, promotion rates post-training, and training ROI calculations. These metrics enable organizations to evaluate program impact by tracking knowledge retention, productivity gains, and career advancement outcomes, with many companies finding that comprehensive measurement ultimately delivers enhanced workforce capabilities and competitive advantage.
HR KPI dashboards facilitate compliance by tracking key metrics like overtime hours, leave balances, training completion rates, wage equity, and regulatory deadlines in real-time. These systems automatically flag potential violations, generate compliance reports, and ensure audit readiness, with many organizations finding that centralized monitoring significantly reduces legal risks while streamlining regulatory reporting processes.
Real-time data analytics enhances HR KPI dashboards by providing instant visibility into workforce metrics, enabling immediate identification of trends, and facilitating proactive decision-making. Through continuous data streams, HR teams can monitor employee engagement, track recruitment progress, and address retention issues as they emerge, ultimately delivering faster responses to workforce challenges and improved strategic planning capabilities.
Customizing an HR KPI dashboard delivers enhanced data relevance, improved decision-making accuracy, better stakeholder engagement, streamlined reporting processes, and increased organizational alignment. Through tailored metrics and visualization preferences, companies achieve more targeted workforce insights, faster identification of critical trends, and enhanced strategic planning capabilities, with many organizations finding that customized dashboards ultimately drive superior employee retention and operational efficiency.
No Reviews