


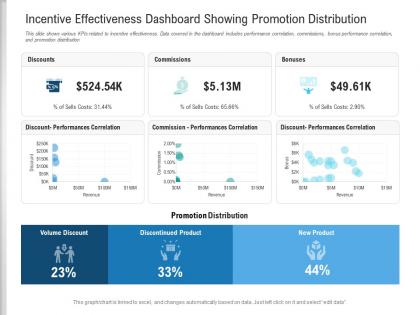
Incentive effectiveness dashboard showing promotion distribution powerpoint template




Try Before you Buy Download Free Sample Product
 Impress Your
 Audience
 100%
100% Editable
 Save Hours
 of Time


Our Incentive Effectiveness Dashboard Showing Promotion Distribution Powerpoint Template are topically designed to provide an attractive backdrop to any subject. Use them to look like a presentation pro.
People who downloaded this PowerPoint presentation also viewed the following :
Incentive effectiveness dashboard showing promotion distribution powerpoint template with all 2 slides:
Use our Incentive Effectiveness Dashboard Showing Promotion Distribution Powerpoint Template to effectively help you save your valuable time. They are readymade to fit into any presentation structure.
FAQs for Incentive effectiveness dashboard showing promotion
Key metrics should include participation rates, goal achievement percentages, cost-per-performance ratios, ROI measurements, and behavioral change indicators across different employee segments. These metrics enable organizations to track program adoption, measure performance outcomes, and optimize incentive investments, with many companies finding that comprehensive dashboards ultimately deliver enhanced employee engagement and improved business results.
Organizations can tailor incentive programs by analyzing demographic data including age, career stage, department, performance levels, and personal motivations to customize reward structures accordingly. Through segmented approaches, companies deliver targeted benefits like flexible work arrangements for parents, professional development for early-career employees, and recognition programs for high performers, ultimately enhancing engagement across diverse workforce populations.
Real-time data enables immediate assessment of incentive program performance by tracking participation rates, behavioral changes, and outcome metrics as they occur, rather than waiting for quarterly reviews. This continuous monitoring allows organizations to quickly identify underperforming initiatives, adjust reward structures mid-campaign, and optimize resource allocation, ultimately delivering more responsive programs and improved ROI across sales teams.
Behavioral psychology enhances incentive programs by incorporating loss aversion, social proof, and timing optimization to maximize engagement and performance outcomes. Through gamification elements, personalized rewards, and peer comparison features, organizations streamline motivation strategies while delivering improved participation rates, sustained behavioral change, and measurable productivity gains across diverse workforce segments.
Common pitfalls in measuring incentive effectiveness include relying on short-term metrics only, failing to account for external market factors, measuring outputs rather than meaningful outcomes, and ignoring participant feedback or behavioral changes. These challenges can be avoided by establishing baseline performance data, implementing multi-timeframe measurement periods, and combining quantitative metrics with qualitative insights, ultimately delivering more accurate assessments of program impact and ROI.
Incentive effectiveness dashboards should be updated in real-time for transactional data and weekly for comprehensive performance analysis, with monthly deep-dive reviews for strategic adjustments. This balanced approach enables organizations to respond quickly to performance trends while maintaining strategic oversight, with many companies finding that combining daily activity tracking with weekly outcome analysis delivers optimal motivation and accurate performance measurement.
Performance heatmaps, trend line charts, comparative bar graphs, correlation scatter plots, and goal achievement meters effectively visualize incentive impacts on employee performance. These visualizations enable organizations to track productivity changes, identify high-performing teams, and measure ROI across departments, with many companies finding that visual data drives more strategic compensation decisions and enhances workforce motivation.
Cultural differences significantly influence incentive perception through varying values around individual versus collective achievement, monetary versus non-monetary rewards, and hierarchical versus egalitarian recognition structures. While Western teams often prefer individual bonuses and public recognition, Asian teams frequently value group achievements and respectful private acknowledgment, with many global organizations finding that localized incentive strategies deliver higher engagement and performance outcomes.
Sales-driven industries like pharmaceuticals, financial services, technology, and automotive benefit most from incentive effectiveness dashboards because they rely heavily on complex commission structures and performance metrics. These sectors typically manage large sales teams with varied compensation plans, enabling them to optimize payout accuracy, reduce administrative costs, and enhance sales performance visibility, ultimately delivering improved revenue outcomes and competitive advantage.
Qualitative feedback complements quantitative data by providing context behind performance metrics, revealing employee motivations, perceived fairness, and program clarity that numbers alone cannot capture. Through surveys, focus groups, and interviews, organizations uncover why certain incentives succeed or fail, enabling strategic adjustments that enhance engagement, reduce turnover, and ultimately deliver more effective compensation strategies.
Effective tools for creating incentive effectiveness dashboards include Tableau, Power BI, Qlik Sense, Google Data Studio, and Salesforce Analytics, each offering robust data visualization and real-time tracking capabilities. These platforms streamline performance monitoring by integrating multiple data sources, automating report generation, and delivering interactive analytics, with many organizations finding that cloud-based solutions like Power BI enhance accessibility while reducing IT overhead costs.
Organizations utilize A/B testing to refine incentive structures by comparing different reward types, timing mechanisms, and delivery methods across employee segments to measure engagement and performance outcomes. Through systematic testing, companies can identify optimal incentive combinations, eliminate ineffective rewards, and personalize motivation strategies, with many finding that data-driven refinements increase program ROI and employee satisfaction significantly.
Incentive program benchmarks should include participation rates, goal achievement percentages, cost-per-participant ratios, employee engagement scores, and retention improvements following program implementation. These metrics enable organizations to measure both immediate performance outcomes and long-term strategic value, with many companies finding that tracking multiple benchmarks simultaneously delivers comprehensive insights into program effectiveness and competitive advantage.
Incentive effectiveness dashboards aid retention strategies by analyzing compensation patterns, tracking employee engagement metrics, and identifying at-risk talent through predictive analytics. These tools enable HR teams to customize retention packages, benchmark against industry standards, and proactively address compensation gaps, with many organizations finding significantly reduced turnover rates and enhanced employee satisfaction.
Management buy-in is critical for incentive program success, as leaders provide necessary resources, communicate program value, ensure fair implementation, and model expected behaviors throughout the organization. Without strong leadership support, programs often fail due to inadequate funding, poor communication, inconsistent application, and employee skepticism, with many organizations finding that visible management commitment directly correlates with participation rates and achievement outcomes.
-
Use of icon with content is very relateable, informative and appealing.
-
Much better than the original! Thanks for the quick turnaround.
-
Colors used are bright and distinctive.
-
It saves your time and decrease your efforts in half.
-
Great designs, really helpful.
-
Informative design.