


Increase revenue growth chart powerpoint guide




Try Before you Buy Download Free Sample Product
 Impress Your
 Audience
 100%
100% Editable
 Save Hours
 of Time


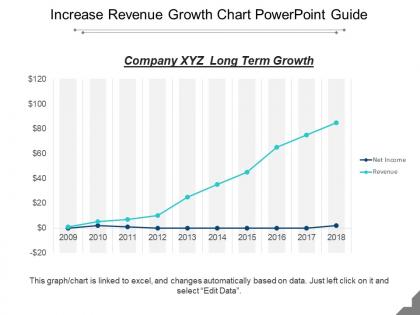
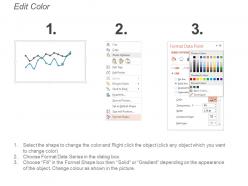
Reinvent your business growth with our increase revenue growth chart PowerPoint guide. Our revenue generation plan presentation template can be used to visualize your current strategy which supports the overall business goals and helps in building brand equity to attract more customers. This template on increase in profits has been designed by our professional team members and helps in scaling marketing efforts, which can generate more leads, hence is a direct revenue driver. Our increase in sales PowerPoint slide will assist in adding existing client base with new products, giving complementary services to existing products, and by offering special discounts. This slideshow on sales growth strategies allows you to constantly change the processes so that you have understanding and knowledge of the customers you serve. Our Increase Revenue Growth Chart Powerpoint Guide enable close guidance of activities. They keep it from going hay wire.
People who downloaded this PowerPoint presentation also viewed the following :
Increase revenue growth chart powerpoint guide with all 5 slides:
Formulate effective guidelines for the future with our Increase Revenue Growth Chart Powerpoint Guide. Elaborate on important instances.
FAQs for Increase revenue growth
Effective presentation techniques include data visualization through compelling charts and graphs, storytelling with customer success narratives, scenario modeling for different growth trajectories, competitive benchmarking against industry leaders, and clear ROI projections with timeline milestones. These approaches enhance stakeholder understanding by combining quantitative evidence with qualitative insights, ultimately delivering persuasive presentations that demonstrate scalable revenue opportunities and strategic competitive advantage.
Data visualization in presentations enhances revenue trend understanding by transforming complex financial data into clear charts, graphs, and interactive dashboards that reveal patterns, seasonal fluctuations, and growth opportunities. Through compelling visual storytelling, sales teams and executives can quickly identify underperforming segments, forecast future performance, and communicate strategic insights to stakeholders, ultimately enabling faster decision-making and revenue optimization.
Storytelling elements transform revenue growth presentations by creating emotional connections, simplifying complex data through narrative arcs, and making financial projections more memorable and relatable. Through compelling customer success stories, transformation narratives, and future vision scenarios, organizations enhance audience engagement, build stronger investor confidence, and ultimately secure better funding outcomes, with many companies finding that story-driven presentations achieve significantly higher approval rates.
Businesses can standardize revenue proposals by using presentation templates that incorporate consistent branding, structured pricing frameworks, compelling value propositions, and proven persuasion sequences. These templates streamline proposal development, reduce preparation time, and ensure uniform messaging across sales teams, with many organizations finding that standardized approaches increase win rates and accelerate deal closures significantly.
Revenue growth presentations should highlight key performance indicators like customer acquisition cost, lifetime value, conversion rates, market share expansion, and recurring revenue percentages. These metrics demonstrate strategic value by showcasing operational efficiency, customer retention success, and scalable growth opportunities, with many organizations finding that combining financial projections with competitive benchmarking data ultimately delivers compelling investment justification.
Businesses can tailor revenue growth presentations by emphasizing financial metrics and ROI projections for investors, strategic initiatives and operational efficiency for management, and individual contributions and career development opportunities for staff. This targeted approach enables organizations to align messaging with audience priorities, enhance stakeholder engagement, and ultimately drive support for revenue-generating initiatives across all organizational levels.
Common pitfalls include overwhelming audiences with excessive data, focusing solely on financial metrics without strategic context, neglecting visual clarity through cluttered slides, and failing to connect growth initiatives to actionable outcomes. These presentation mistakes undermine credibility by confusing stakeholders, obscuring key insights, and missing opportunities to secure buy-in, with many organizations finding that clear, focused revenue narratives drive better investment decisions.
Incorporating case studies into revenue growth presentations adds credibility through real-world proof points, demonstrates measurable outcomes across different scenarios, and provides specific frameworks that audiences can adapt to their situations. These evidence-based examples help stakeholders visualize potential returns, build confidence in proposed strategies, and accelerate decision-making processes, with many organizations finding that documented success stories significantly enhance buy-in for revenue initiatives.
Essential design elements for communicating intricate revenue data include clean data visualizations, consistent color coding, clear hierarchical typography, strategic white space, and interactive dashboard layouts. These elements streamline complex financial information by enhancing readability, reducing cognitive load, and highlighting key performance trends, with many organizations finding that well-designed revenue presentations accelerate stakeholder decision-making and strategic planning processes.
Businesses should update their revenue growth presentation templates quarterly or bi-annually, aligning with financial reporting cycles, market shifts, and strategic pivots. This regular refresh enables organizations to incorporate current performance metrics, emerging market trends, and updated forecasting models, while maintaining stakeholder engagement through contemporary design elements, ultimately delivering more compelling narratives that drive investment decisions and strategic alignment.
Revenue growth presentation strategies include demonstrating clear ROI projections, showcasing competitor success stories, presenting phased implementation timelines, highlighting customer pain points that drive demand, and connecting initiatives to specific market opportunities. These approaches build stakeholder confidence by combining data-driven insights with practical implementation frameworks, ultimately securing organizational commitment and resource allocation for scalable growth initiatives.
Competitive analysis can be effectively presented through visual comparison matrices, market positioning maps, competitor revenue breakdowns, gap analysis charts, and opportunity identification frameworks. These presentations enable organizations to pinpoint underserved market segments, pricing optimization potential, and service expansion opportunities, ultimately delivering strategic insights that drive targeted revenue growth initiatives and competitive advantage.
Key takeaways should include current revenue trends, growth opportunity analysis, competitive positioning strategies, customer acquisition metrics, and projected ROI timelines. These elements work together by demonstrating market understanding, strategic planning capabilities, and measurable outcomes, with many organizations finding that presentations combining data-driven insights with clear implementation roadmaps ultimately secure stakeholder buy-in and accelerate growth initiatives.
A persuasive call to action for revenue growth presentations combines specific metrics, clear timelines, and defined ownership, connecting proposed strategies directly to measurable financial outcomes. Through strategic positioning of next steps, presenters enable stakeholders to visualize implementation pathways, resource requirements, and projected returns, with many organizations finding that actionable recommendations with quantified benefits drive faster decision-making and executive buy-in.
Charts, graphs, line trends, bar comparisons, and interactive dashboards are most effective for presenting revenue growth data. These visual aids enhance comprehension by transforming complex financial information into digestible formats, enabling stakeholders to quickly identify patterns, benchmark performance against competitors, and make strategic decisions, with many organizations finding that compelling data visualization ultimately drives faster buy-in and investment decisions.
-
Use of different colors is good. It's simple and attractive.
-
Use of different colors is good. It's simple and attractive.