


International Auto Sector Assessment Powerpoint Presentation Slides


Try Before you Buy Download Free Sample Product
 Impress Your
 Audience
Editable
of Time


The global automotive industry is made up of many different firms and organizations that are involved in the designing, development, manufacturing, marketing, and selling of automobiles. It is one of the worlds most profitable industries, with the largest R and D investment per business. Check out our efficiently designed presentation on International Auto Sector Assessment. It gives a brief overview of the global automobile market, followed by significant industry segments. This PPT also includes a different section for industry analysis consisting of SWOT, PESTLE, and Porters five force model. Then comes the competitive landscape section, which covers the major players and a brief competitive analysis. Further, this template also includes a significant section of recent industry trends in the vehicle manufacturing market. The showcased trends include electric vehicle adoption, autonomous vehicles penetration, connected cars market, online car-buying market, and automotive parts market growth. The PPT slides of this deck also include the share of the global motor vehicle sector in production, sales, and international trade. The last segment of the presentation includes the impact of COVID on the global auto manufacturing industry. Get to know more by downloading our 100 percent editable and customizable template, which is also compatible with google slides.
People who downloaded this PowerPoint presentation also viewed the following :
Content of this Powerpoint Presentation
Slide 1: This slide displays the title International Auto Sector Assessment.
Slide 2: This slide displays the Agenda for the topic.
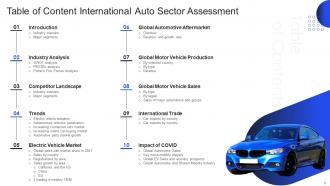
Slide 3: This slide exhibit table of content.
Slide 4: This slide exhibit table of content- Introduction.
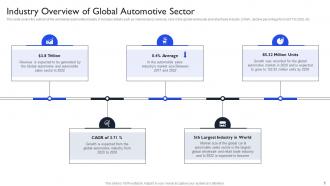
Slide 5: This slide covers the outlook of the worldwide automobile industry.
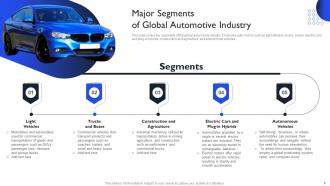
Slide 6: This slide covers key segments of the global automobile industry.
Slide 7: This slide exhibit table of content- Industry Analysis.
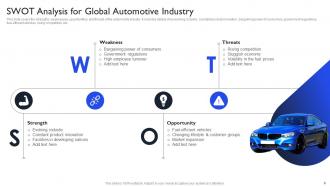
Slide 8: This slide covers the strengths, weaknesses, opportunities, and threats of the automobile industry.
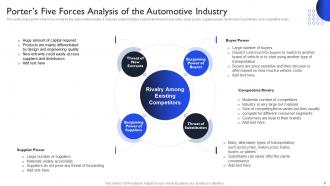
Slide 9: This slide covers porter’s five force model for the automobile industry.
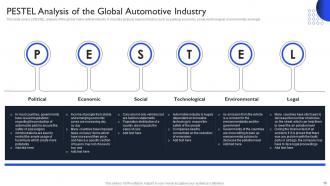
Slide 10: This slide covers a PESTEL analysis of the global motor vehicle industry.
Slide 11: This slide exhibit table of content- Competitor Landscape.
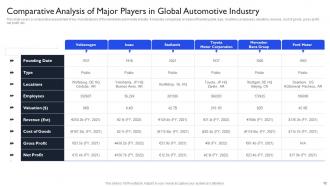
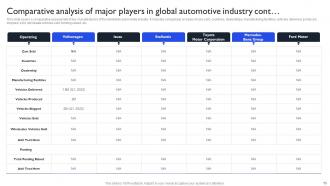
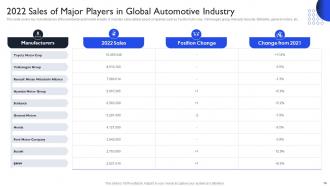
Slide 12: This slide covers a comparative assessment of key manufacturers of the worldwide automobile industry.
Slide 13: This slide covers a comparative assessment of key manufacturers of the worldwide automobile industry.
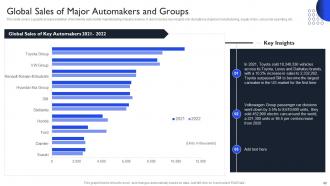
Slide 14: This slide covers key manufacturers of the worldwide automobile industry.
Slide 15: This slide exhibit table of content- Trends.
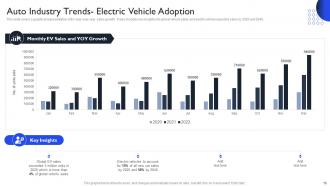
Slide 16: This slide covers a graphical representation of EV year-over-year sales growth.
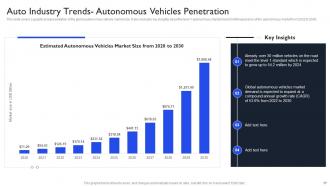
Slide 17: This slide covers a graphical representation of the global autonomous vehicle market size.
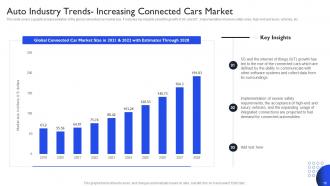
Slide 18: This slide covers a graphical representation of the global connected car market size.
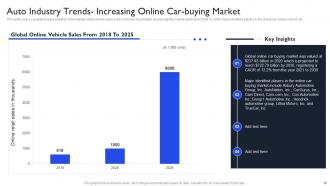
Slide 19: This slide covers a graphical representation of worldwide online vehicle sales.
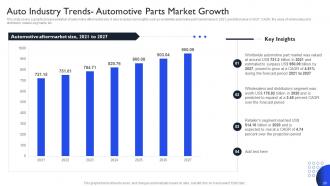
Slide 20: This slide covers a graphical representation of automotive aftermarket size.
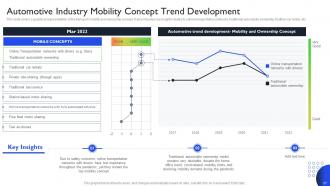
Slide 21: This slide covers a graphical representation of the transport mobility and ownership concept.
Slide 22: This slide exhibit table of content- Electric Vehicle Market.
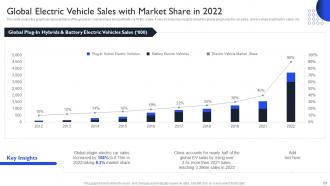
Slide 23: This slide covers the graphical representation of the global EV market share along with BEV & PHEV sales.
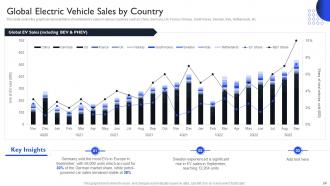
Slide 24: This slide covers the graphical representation of worldwide EV sales in various countries.
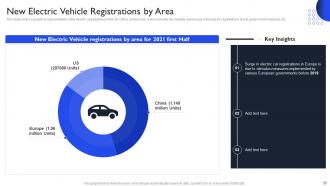
Slide 25: This slide covers a graphical representation of the new EV registrations in the US, China, and Europe.
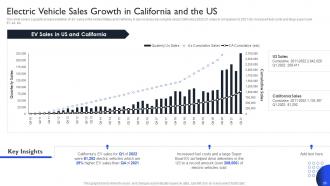
Slide 26: This slide covers a graphical representation of EV sales in the United States and California.
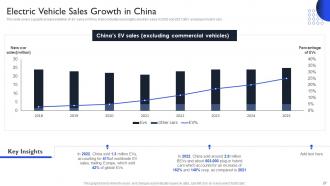
Slide 27: This slide covers a graphical representation of EV sales in China.
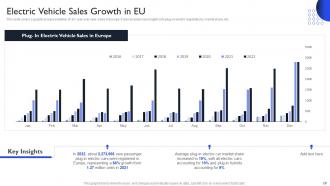
Slide 28: This slide covers a graphical representation of EV year-over-year sales in Europe.
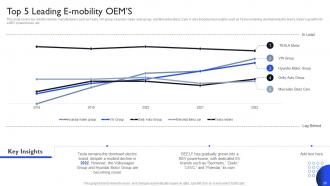
Slide 29: This slide covers key electric vehicle manufacturers such as Tesla, VW group, Hyundai, Geely auto group, and Mercedes Benz Cars.
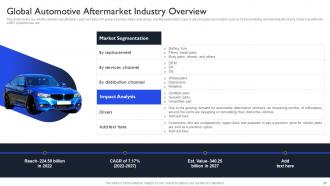
Slide 30: This slide exhibit table of content- Global Automotive Aftermarket.
Slide 31: This slide covers key electric vehicle manufacturers such as Tesla, VW group, Hyundai, Geely auto group, and Mercedes Benz Cars.
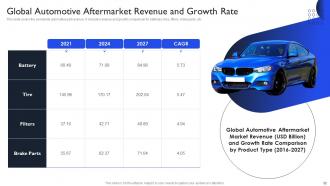
Slide 32: This slide covers the worldwide automotive part revenue.
Slide 33: This slide exhibit table of content- Global Motor Vehicle Production.
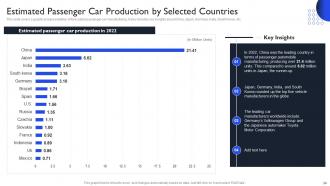
Slide 34: This slide covers a graphical representation of forecasted passenger car manufacturing.
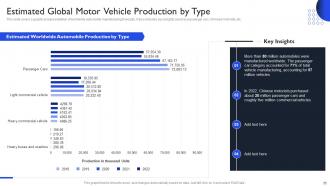
Slide 35: This slide covers a graphical representation of worldwide automobile manufacturing forecasts.
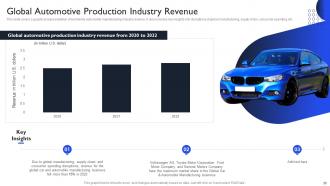
Slide 36: This slide covers a graphical representation of worldwide automobile manufacturing industry revenue.
Slide 37: This slide exhibit table of content- Global Motor Vehicle Production.
Slide 38: This slide covers a graphical representation of worldwide automobile manufacturing industry revenue.
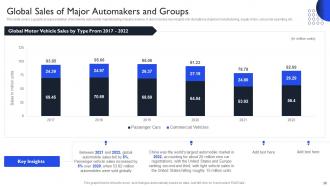
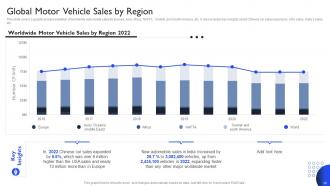
Slide 39: This slide covers a graphical representation of worldwide automobile sales for Europe, Asia, Africa, NAFTA, Central, and South America, etc.
Slide 40: This slide covers a graphical representation of worldwide automobile manufacturing industry revenue.
Slide 41: This slide exhibit table of content- International Trade.
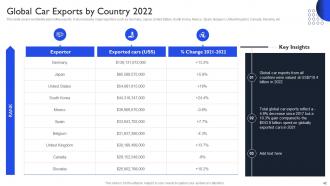
Slide 42: This slide covers worldwide automotive exports.
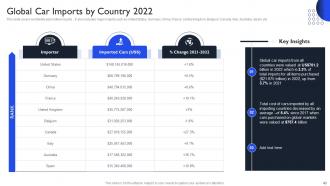
Slide 43: This slide covers worldwide automotive imports.
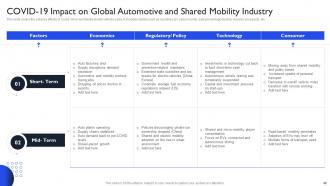
Slide 44: This slide exhibit table of content- Impact of COVID.
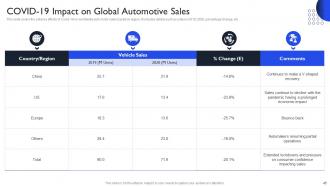
Slide 45: This slide covers the adverse effects of Covid-19 on worldwide auto motor sales based on region.
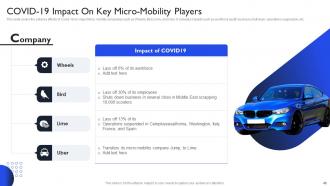
Slide 46: This slide covers the adverse effects of Covid-19 on major Micro mobility companies such as Wheels, Bird, Lime, and Uber.
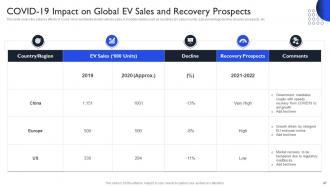
Slide 47: This slide covers the adverse effects of Covid-19 on worldwide electric vehicle sales.
Slide 48: This slide covers the adverse effects of Covid-19 on worldwide electric vehicle sales.
Slide 49: This slide presents title for additional slides.
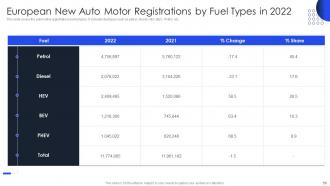
Slide 50: This slide covers the automotive registrations by fuel types.
Slide 51: This is the icons slide.
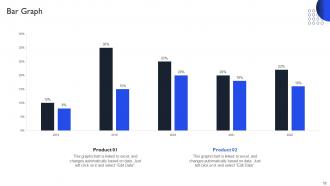
Slide 52: This slide displays yearly bar graph for different products. The graphs are linked to Excel.
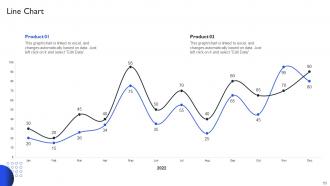
Slide 53: This slide exhibits yearly profits stacked line charts for different products. The charts are linked to Excel.
Slide 54: This slide shows roadmap of company.
Slide 55: This slide exhibits ideas generated.
Slide 56: This slide depicts posts for past experiences of clients.
Slide 57: This slide showcases financials of company.
Slide 58: This slide shows puzzle for displaying elements of company.
Slide 59: This is thank you slide & contains contact details of company like office address, phone no., etc.
International Auto Sector Assessment Powerpoint Presentation Slides with all 64 slides:
Use our International Auto Sector Assessment Powerpoint Presentation Slides to effectively help you save your valuable time. They are readymade to fit into any presentation structure.


-
“One of the best experiences with SlideTeam for my presentation.Everything on time, communication is efficient and price is reasonable. All good in one place.”
-
Great product with highly impressive and engaging designs.