


Inventory Reduction Dashboard For E Commerce Firm




Try Before you Buy Download Free Sample Product
 Impress Your
 Audience
 100%
100% Editable
 Save Hours
 of Time


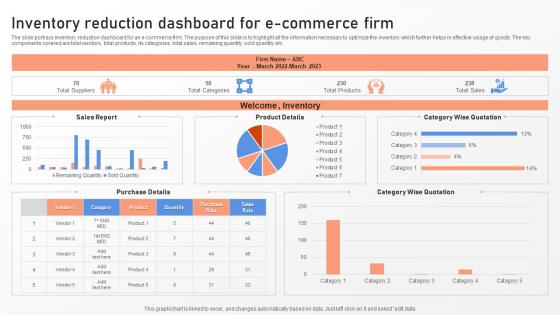
The slide portrays inventory reduction dashboard for an e commerce firm. The purpose of this slide is to highlight all the information necessary to optimize the inventory which further helps in effective usage of goods. The key components covered are total vendors, total products, its categories, total sales, remaining quantity, sold quantity etc.
People who downloaded this PowerPoint presentation also viewed the following :
Inventory Reduction Dashboard For E Commerce Firm with all 7 slides:
Use our Inventory Reduction Dashboard For E Commerce Firm to effectively help you save your valuable time. They are readymade to fit into any presentation structure.





FAQs for Inventory Reduction Dashboard For
Key metrics include inventory turnover ratio, carrying costs, stockout frequency, excess inventory levels, and demand forecast accuracy. These indicators streamline operational efficiency by identifying slow-moving stock, minimizing storage expenses, and optimizing reorder points, with many retail and manufacturing organizations finding that comprehensive tracking ultimately delivers cost reductions and enhanced cash flow management.
An Inventory Reduction Dashboard identifies slow-moving or obsolete stock by tracking turnover rates, aging analysis, demand patterns, and seasonal trends across all product categories. Through automated alerts and visual analytics, organizations can quickly spot items with declining sales velocity, excess holding periods, or zero movement, enabling proactive markdowns, strategic liquidation, and optimized procurement decisions that ultimately reduce carrying costs and improve cash flow.
Effective inventory dashboard visualizations include time-series line charts for trend analysis, gauge charts for stock level thresholds, heat maps for category performance, waterfall charts for reduction tracking, and comparative bar charts for period-over-period analysis. These techniques enable supply chain managers and operations teams to quickly identify overstock situations, monitor reduction progress, and optimize inventory turnover, ultimately delivering improved cash flow and operational efficiency.
Integrating real-time data transforms inventory reduction dashboards by providing instant visibility into stock levels, demand fluctuations, and supply chain disruptions, enabling immediate response to market changes. This real-time capability allows businesses to optimize reorder points, reduce excess inventory by up to 30%, and minimize stockouts, with many retail and manufacturing organizations finding that automated alerts and predictive analytics ultimately deliver significant cost savings and improved cash flow.
Forecasting serves as the foundational element that drives predictive analytics, demand planning, seasonal adjustments, and supplier coordination strategies within Inventory Reduction Dashboards. These predictive insights enable organizations to optimize stock levels, minimize carrying costs, and reduce waste across manufacturing, retail, and distribution operations, ultimately delivering improved cash flow and competitive advantage in increasingly dynamic market conditions.
Businesses can utilize historical sales data to identify seasonal trends, forecast demand patterns, optimize reorder points, analyze product performance cycles, and predict inventory turnover rates displayed on dashboards. Through predictive analytics, companies streamline purchasing decisions, minimize overstock situations, and enhance cash flow management, with many retailers finding that data-driven inventory strategies reduce carrying costs while improving product availability.
Incorporating supplier lead times into an Inventory Reduction Dashboard enables more accurate demand forecasting, optimized reorder points, reduced stockouts, improved cash flow management, and enhanced supplier relationship coordination. This strategic integration allows organizations to minimize excess inventory while maintaining service levels, with manufacturing and retail companies finding that real-time lead time visibility delivers significant cost reductions and operational efficiency.
Inventory turnover ratios can be effectively visualized through trend line charts showing monthly or quarterly performance, comparative bar charts benchmarking against industry standards, and gauge displays indicating current ratio health with color-coded thresholds. These visualizations enable supply chain managers to quickly identify slow-moving stock, optimize reorder points, and enhance cash flow management, with many organizations finding that clear ratio tracking ultimately delivers improved inventory efficiency and reduced carrying costs.
Businesses can reduce excessive inventory through strategic discounting, promotional campaigns, supplier order adjustments, improved demand forecasting, and enhanced inventory turnover strategies. These approaches enable organizations to free up working capital, minimize storage costs, and optimize cash flow, with many retailers and manufacturers finding that data-driven inventory decisions ultimately deliver improved operational efficiency and competitive advantage.
Seasonal demand significantly influences dashboard design through dynamic forecasting algorithms, seasonal trend indicators, and flexible safety stock calculations that adjust automatically based on historical patterns. Retailers and manufacturers increasingly implement predictive analytics that anticipate peak seasons like holidays or back-to-school periods, enabling proactive inventory adjustments, minimizing overstock situations, and ultimately delivering improved cash flow while maintaining optimal service levels.
**INPUT**: What software solutions are best suited for creating an effective Inventory Reduction Dashboard? **OUTPUT**: Effective inventory reduction dashboards leverage Tableau, Power BI, QlikView, SAP Analytics Cloud, and Oracle Business Intelligence for comprehensive data visualization and analysis. These platforms streamline inventory optimization by integrating real-time data feeds, automated forecasting algorithms, and predictive analytics capabilities, with many retail and manufacturing organizations finding that strategic dashboard implementation delivers significant cost reductions and enhanced operational efficiency. **Word count: 58 words**
User feedback significantly influences dashboard development through usability testing, feature prioritization, interface optimization, and performance enhancement requests. Through continuous feedback loops, organizations can identify pain points, streamline navigation workflows, and add predictive analytics capabilities, while many retail and manufacturing companies finding that user-driven iterations ultimately deliver more intuitive inventory management and enhanced operational efficiency.
Common pitfalls include overcomplicating visualizations with excessive metrics, failing to align KPIs with actual business objectives, neglecting real-time data integration, and creating dashboards without proper user input from warehouse managers and procurement teams. These design flaws ultimately compromise decision-making effectiveness, with many organizations finding that streamlined, role-specific dashboards deliver significantly better inventory optimization results.
Mobile accessibility enables decision-makers to monitor inventory levels, track reduction progress, and respond to critical alerts from anywhere, ensuring timely interventions and faster decision-making. This real-time capability allows managers to approve urgent restocking orders, address supply chain disruptions, and optimize inventory allocation while traveling or working remotely, ultimately delivering operational agility and competitive responsiveness.
Key benchmarks include inventory turnover ratios, carrying cost reduction percentages, stockout frequencies, demand forecast accuracy rates, and working capital optimization metrics. These indicators enable organizations to measure operational efficiency, cost savings, and service level improvements, with many companies finding that tracking these benchmarks simultaneously delivers better inventory management and enhanced competitive advantage.
-
Informative presentations that are easily editable.
-
The templates are handy and I can personalize them as per my needs. Glad to be your subscriber!