


IT Project Operational Analytics And Performance Dashboard


Try Before you Buy Download Free Sample Product
 Impress Your
 Audience
Editable
of Time


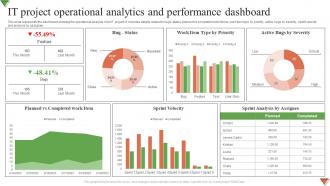
This slide represents the dashboard showing the operational analysis of an IT project. It includes details related to bugs status, planned vs completed work items, work item type by priority, active bugs by severity, sprint velocity and analysis by assignee.
This slide represents the dashboard showing the operational analysis of an IT project. It includes details related to bugs status, planned vs completed work items, work item type by priority, active bugs by severity, sprint velocity and analysis by assignee. Introducing our IT Project Operational Analytics And Performance Dashboard set of slides. The topics discussed in these slides are Work Item Type, Active Bugs Severity, Sprint Velocity. This is an immediately available PowerPoint presentation that can be conveniently customized. Download it and convince your audience.
People who downloaded this PowerPoint presentation also viewed the following :
IT Project Operational Analytics And Performance Dashboard with all 7 slides:
Use our IT Project Operational Analytics And Performance Dashboard to effectively help you save your valuable time. They are readymade to fit into any presentation structure.


Most Relevant Reviews
-
Their professional templates are very impressive, even my manager was curious about the source. I am very grateful.
-
Based on my personal experience, I would recommend other people to subscribe to SlideTeam. No one can be disappointed here!