


KPI Analysis Of HR Department On Power BI




Try Before you Buy Download Free Sample Product
 Impress Your
 Audience
 100%
100% Editable
 Save Hours
 of Time


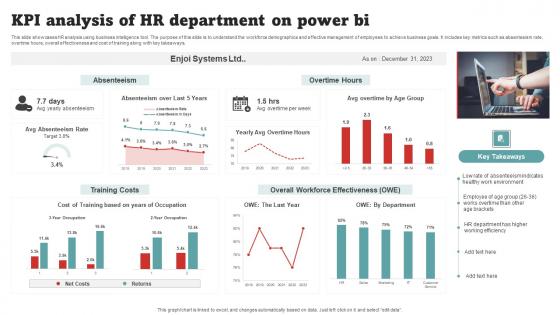
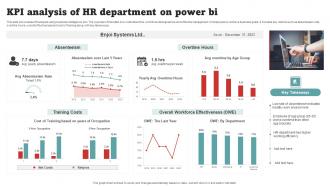
This slide showcases HR analysis using business intelligence tool. The purpose of this slide is to understand the workforce demographics and effective management of employees to achieve business goals. It includes key metrics such as absenteeism rate, overtime hours, overall effectiveness and cost of training along with key takeaways.
People who downloaded this PowerPoint presentation also viewed the following :
KPI Analysis Of HR Department On Power BI with all 10 slides:
Use our KPI Analysis Of HR Department On Power BI to effectively help you save your valuable time. They are readymade to fit into any presentation structure.








FAQs for KPI Analysis Of HR Department
Key HR analytics KPIs include employee turnover rate, time-to-hire, employee engagement scores, absenteeism rates, and training effectiveness metrics. These indicators enable organizations to streamline talent management, reduce recruitment costs, and enhance workforce productivity, with many companies finding that comprehensive KPI tracking ultimately delivers improved retention and operational efficiency.
Power BI streamlines HR reporting by automating data collection from multiple HR systems, creating real-time dashboards, and enabling self-service analytics for managers and executives. Through interactive visualizations, organizations can track employee turnover, recruitment metrics, performance indicators, and compensation analysis instantly, while reducing manual reporting time by up to 80%, ultimately delivering faster decision-making and strategic workforce insights.
Power BI integrates with numerous HR data sources including HRIS systems, payroll platforms, recruitment databases, performance management tools, and employee survey platforms. These integrations enable organizations to consolidate workforce data from multiple touchpoints, streamline reporting processes, and deliver comprehensive analytics dashboards, with many HR departments finding that unified data visualization significantly enhances strategic decision-making and operational efficiency.
Real-time data analysis in Power BI enhances HR decision-making by providing instant visibility into workforce metrics, enabling immediate identification of trends, and facilitating proactive responses to emerging issues. Through automated dashboards tracking employee performance, turnover rates, and engagement scores, HR teams streamline strategic planning, minimize recruitment costs, and ultimately deliver enhanced organizational efficiency with improved talent retention.
Best practices for HR KPI dashboards in Power BI include using clear visual hierarchies, implementing role-based access controls, standardizing metrics across departments, creating interactive drill-down capabilities, and ensuring real-time data integration. These approaches streamline workforce analytics by enhancing data accessibility, improving decision-making speed, and delivering comprehensive insights into employee performance, retention rates, and recruitment efficiency, ultimately enabling HR teams to drive strategic organizational outcomes.
Power BI helps identify employee turnover trends by visualizing departure patterns across departments, tenure periods, exit reasons, and seasonal fluctuations through interactive dashboards and time-series analytics. Through automated data integration, HR teams can track leading indicators, predict at-risk employee segments, and benchmark turnover rates against industry standards, ultimately enabling proactive retention strategies and reducing recruitment costs.
Employee engagement data serves as a foundational metric in HR KPIs, measuring satisfaction, retention rates, productivity levels, and overall workplace culture health across organizations. Power BI transforms this data through interactive dashboards, heat maps, and trend visualizations, enabling HR teams to identify engagement patterns, predict turnover risks, and benchmark performance across departments, ultimately delivering strategic insights that enhance workforce management and competitive advantage.
Predictive analytics in Power BI enhances talent acquisition by analyzing historical hiring data, candidate performance patterns, and market trends to forecast successful recruitment outcomes. Through machine learning models, HR teams can identify ideal candidate profiles, predict time-to-hire metrics, and optimize sourcing channels, ultimately reducing recruitment costs while improving candidate quality and retention rates.
Diversity and inclusion KPI metrics should include representation ratios across demographics, pay equity gaps, recruitment diversity percentages, retention rates by group, and promotion advancement ratios. These metrics enable HR teams to track progress systematically, identify disparities in hiring and advancement processes, and measure the effectiveness of inclusion initiatives, ultimately delivering more equitable workplace outcomes and stronger organizational culture.
Power BI transforms employee performance reviews by creating interactive dashboards that aggregate feedback scores, track performance trends across departments, and identify high and low performers through visual analytics. Through automated data integration from HR systems, organizations can analyze review patterns, compare team performance metrics, and generate actionable insights that streamline talent management decisions, ultimately enhancing workforce optimization and employee development strategies.
HR professionals can monitor training and development effectiveness in Power BI through completion rate dashboards, skills assessment scorecards, performance correlation matrices, ROI calculators, and engagement tracking visualizations. These techniques enable organizations to measure training impact by analyzing employee progression, competency improvements, and business outcomes, with many companies finding that data-driven learning analytics ultimately enhance workforce capabilities and deliver measurable competitive advantages.
Power BI enables recruitment efficiency analysis through KPIs like time-to-hire, cost-per-hire, source effectiveness, candidate conversion rates, and recruiter productivity metrics. These dashboards streamline talent acquisition by identifying bottlenecks, optimizing sourcing channels, and tracking hiring funnel performance, with many HR teams finding that automated reporting delivers faster decision-making and ultimately reduces recruitment costs while improving candidate quality.
Common pitfalls include overloading dashboards with too many metrics, using inconsistent data sources, neglecting data privacy regulations, and creating visuals that don't align with stakeholder needs. Organizations should focus on relevant KPIs, ensure data accuracy through proper validation, implement appropriate security measures for sensitive employee information, and regularly gather feedback from HR teams to refine reports, ultimately delivering actionable insights.
Power BI supports HR compliance tracking through automated data collection, real-time monitoring dashboards, and standardized reporting templates that ensure regulatory adherence. These capabilities streamline compliance processes by tracking key metrics like equal opportunity employment, training certifications, and safety incidents, with many organizations finding that automated reporting reduces compliance costs while delivering faster, more accurate regulatory submissions and audit-ready documentation.
Benchmarking HR KPIs against industry standards using Power BI delivers strategic insights by identifying performance gaps, highlighting competitive advantages, and revealing optimization opportunities across talent management functions. This approach enables organizations to contextualize metrics like turnover rates, recruitment costs, and employee satisfaction against sector-specific benchmarks, ultimately driving data-informed HR decisions and enhancing organizational competitiveness.
-
It saves your time and decrease your efforts in half.
-
Presentation Design is very nice, good work with the content as well.