


KPI Dashboard For IT Managed Services




Try Before you Buy Download Free Sample Product
 Impress Your
 Audience
 100%
100% Editable
 Save Hours
 of Time


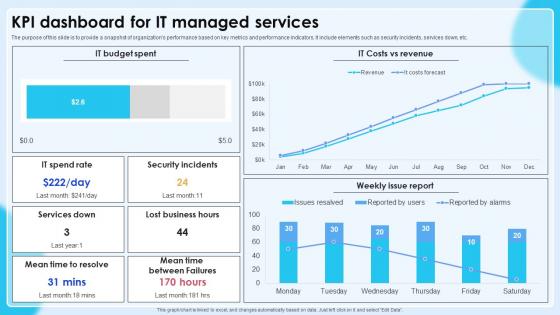
The purpose of this slide is to provide a snapshot of organizations performance based on key metrics and performance indicators. It include elements such as security incidents, services down, etc.
People who downloaded this PowerPoint presentation also viewed the following :
KPI Dashboard For IT Managed Services with all 10 slides:
Use our KPI Dashboard For IT Managed Services to effectively help you save your valuable time. They are readymade to fit into any presentation structure.









FAQs for KPI Dashboard For
Key performance indicators for IT managed services dashboards include system uptime, incident response time, resolution rates, security breach frequency, and customer satisfaction scores. These KPIs enable service providers to monitor operational efficiency, track service level agreements, and identify improvement opportunities, with many organizations finding that comprehensive dashboard visibility ultimately delivers enhanced client relationships and competitive advantage in managed services.
An IT managed services dashboard enhances decision-making by providing real-time visibility into system performance, service delivery metrics, and resource utilization patterns through centralized data visualization. These comprehensive dashboards enable IT managers to identify bottlenecks quickly, allocate resources strategically, and proactively address issues before they impact business operations, ultimately delivering improved service levels and operational efficiency.
Real-time data transforms IT KPI dashboards from static reporting tools into dynamic decision-making platforms, enabling immediate identification of performance issues, resource bottlenecks, and service disruptions before they impact business operations. This instant visibility allows IT teams to proactively address problems, optimize resource allocation, and maintain service level agreements, with many organizations finding that real-time monitoring significantly reduces downtime and enhances overall operational efficiency.
KPI dashboards can be tailored by creating role-specific views that highlight relevant metrics, customizing visualization formats, and establishing different access levels based on stakeholder responsibilities. Through strategic segmentation, executives focus on high-level performance indicators while technical teams monitor operational metrics, and department heads track resource utilization, ultimately delivering targeted insights that enhance decision-making across organizational levels.
Common pitfalls include overloading dashboards with excessive metrics, focusing solely on technical metrics while ignoring business outcomes, using poor data visualization that obscures insights, and failing to align KPIs with client expectations. Many IT service providers find that successful dashboards balance operational metrics like system uptime with strategic indicators such as cost savings and customer satisfaction, ultimately delivering transparency that strengthens client relationships and demonstrates measurable value.
Automated reporting features streamline KPI monitoring by eliminating manual data collection, providing real-time performance updates, and generating scheduled reports across multiple service areas simultaneously. These systems enable IT teams to identify trends, respond to incidents faster, and allocate resources more effectively, while delivering enhanced transparency to clients and ultimately reducing operational overhead by up to forty percent.
Customer satisfaction metrics in IT managed services include response time to incidents, resolution rates, system uptime percentages, user experience scores, and Net Promoter Score (NPS). These indicators can be visualized through real-time dashboards featuring heat maps for service availability, trend charts for ticket resolution times, and satisfaction scorecards, enabling service providers to identify improvement opportunities and demonstrate value to clients.
KPI dashboards for managed services should be updated in real-time for critical metrics like system uptime and security alerts, while operational metrics can refresh hourly or daily. This strategic combination enables IT teams to respond immediately to incidents, track service level agreements accurately, and provide clients with transparent performance reporting, ultimately delivering faster resolution times and enhanced customer confidence in an increasingly competitive managed services landscape.
Predictive analytics can be integrated through forecasting models for system failures, capacity planning algorithms, performance trend analysis, automated anomaly detection, and predictive maintenance scheduling. These capabilities enable IT service providers to anticipate infrastructure issues, optimize resource allocation, and proactively address potential problems, ultimately delivering faster resolution times, reduced downtime costs, and enhanced service reliability for clients.
Balancing data visualization complexity requires progressive disclosure, intuitive design hierarchies, and role-based customization that presents essential metrics prominently while offering drill-down capabilities for detailed analysis. Effective dashboards use clear visual indicators, standardized color coding, and contextual tooltips, enabling non-technical stakeholders to quickly grasp performance trends and KPI statuses while maintaining access to comprehensive data when needed.
**INPUT**: What tools and technologies are recommended for creating effective KPIs on a managed services dashboard? **OUTPUT**: Recommended tools include Microsoft Power BI, Tableau, Grafana, ServiceNow dashboards, and SolarWinds monitoring platforms. These technologies streamline KPI visualization by integrating real-time data feeds, automating report generation, and enabling customizable metrics tracking, with many IT service providers finding that comprehensive dashboard solutions ultimately deliver enhanced client transparency and operational efficiency.
Industry standards and benchmarks significantly influence KPI selection by providing proven metrics for service availability, response times, resolution rates, and customer satisfaction that align with established best practices. These frameworks, such as ITIL and ISO 20000, enable managed service providers to deliver consistent, measurable outcomes while meeting client expectations, ultimately ensuring competitive positioning and demonstrating tangible value in service delivery performance.
Historical KPI trends on managed services dashboards reveal performance patterns, seasonal variations, capacity planning needs, service improvement opportunities, and resource allocation effectiveness across different time periods. These insights enable IT teams to predict future demands, identify recurring issues, optimize service delivery processes, and demonstrate ROI to stakeholders, ultimately delivering proactive maintenance strategies and enhanced operational efficiency.
A KPI dashboard helps identify improvement areas in managed IT services by tracking response times, system uptime, resolution rates, customer satisfaction scores, and resource utilization patterns. Through real-time monitoring and trend analysis, service providers can pinpoint bottlenecks in help desk operations, optimize technician allocation, and enhance service delivery protocols, ultimately delivering faster resolution times and improved client satisfaction.
Best practices for presenting KPI dashboard data include using clear visual hierarchies, consistent color coding, real-time updates, intuitive layouts, and actionable metrics that align with business objectives. These approaches streamline decision-making by minimizing cognitive load, enhancing data comprehension, and enabling quick identification of performance trends, with many IT service organizations finding that well-designed dashboards ultimately deliver faster incident resolution and improved client satisfaction.
-
No second thoughts when I’m looking for excellent templates. SlideTeam is definitely my go-to website for well-designed slides.
-
Wonderful ideas and visuals. I'm really pleased with the templates, which are unique and up to date.