

Line Chart Representing Results Summary Of Product Sales


Try Before you Buy Download Free Sample Product
 Impress Your
 Audience
Editable
of Time


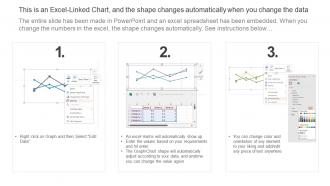
This slide shows the graphical representation of sales volume of company products which includes product A , B and C which helps company to analyze the acceptability of products by potential customers.
This slide shows the graphical representation of sales volume of company products which includes product A , B and C which helps company to analyze the acceptability of products by potential customers.Presenting our well structured Line Chart Representing Results Summary Of Product Sales The topics discussed in this slide are Sales Increasing, Company Generated, Maximum Revenues. This is an instantly available PowerPoint presentation that can be edited conveniently. Download it right away and captivate your audience.
People who downloaded this PowerPoint presentation also viewed the following :
Line Chart Representing Results Summary Of Product Sales with all 7 slides:
Use our Line Chart Representing Results Summary Of Product Sales to effectively help you save your valuable time. They are readymade to fit into any presentation structure.


Most Relevant Reviews
-
SlideTeam is the way to go when you are in a time crunch. Their templates have saved me many times in the past three months.
-
The design is very attractive, informative, and eye-catching, with bold colors that stand out against all the basic presentation templates.