


Logistics dashboard with revenue breakdown and time to market




Try Before you Buy Download Free Sample Product
 Impress Your
 Audience
 100%
100% Editable
 Save Hours
 of Time


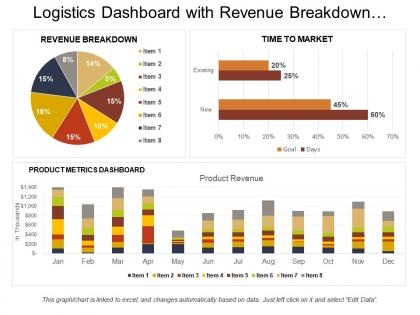
The Logistics Dashboard With Revenue Breakdown And Time To Market PowerPoint Template is a strategic presentation tool for business managers. Time to Market Dashboard PPT slide helps in demonstrating the ideas, feasibility, and target market of a product or service. Therefore, Business Logistics Dashboard presentation template is a perfect tool for business view of products. The Revenue Breakdown PowerPoint slide is ideal for clients as well as investors who can look at the visualization format of the entire plan in one image slide. It will also save the time which needed to go through lengthy documentation of analysis report and further it helps in making the decisions quickly. The team can use the Time to Market PPT template for discussion of a development plan by taking all the components or factors in consideration. The Pie Chart Diagram is a useful tool to describe the revenue in proportion. A user can use the Product Metric and Dashboard bar graph slide to present the product revenue. The Bar and Slide Graph presentation template helps business professionals to manage the product development phase. Assemble your ideas with our Logistics Dashboard With Revenue Breakdown And Time To Market. Create a completely credible image.
People who downloaded this PowerPoint presentation also viewed the following :
Logistics dashboard with revenue breakdown and time to market with all 6 slides:
Increase their ability to absorb future drawbacks with our Logistics Dashboard With Revenue Breakdown And Time To Market. Advise folks to get insured.


FAQs for Logistics dashboard with revenue breakdown and
Key logistics dashboard KPIs include on-time delivery rates, inventory turnover, order accuracy, transportation costs, warehouse efficiency, and supplier performance metrics. These indicators enable supply chain managers to identify bottlenecks, optimize resource allocation, and enhance operational efficiency, with many logistics companies finding that real-time KPI monitoring ultimately delivers faster deliveries and significantly reduced operational costs.
Real-time data integration enhances logistics dashboards by providing instant visibility into shipment status, inventory levels, route optimization, and delivery performance across the entire supply chain. Through continuous data streams, logistics companies can proactively address delays, optimize resource allocation, and improve customer communication, ultimately delivering faster response times and enhanced operational efficiency.
Data visualization transforms complex logistics data into intuitive charts, graphs, heatmaps, and real-time metrics that enable faster, more accurate decision-making across supply chain operations. Through interactive dashboards, logistics managers can quickly identify bottlenecks, optimize route planning, and monitor performance indicators, while stakeholders across organizations streamline resource allocation and enhance operational efficiency, ultimately delivering competitive advantage in increasingly complex supply chains.
A logistics dashboard helps identify supply chain bottlenecks by providing real-time visibility into inventory levels, shipment delays, warehouse capacity, and delivery performance metrics. Through automated monitoring and data visualization, logistics teams can quickly pinpoint congestion points, optimize routing decisions, and streamline operations, ultimately reducing costs and enhancing customer satisfaction across their distribution networks.
**INPUT**: What types of analytics are most beneficial to display on a logistics dashboard? **OUTPUT**: Essential logistics dashboard analytics include real-time shipment tracking, delivery performance metrics, inventory turnover rates, cost per shipment, and carrier performance comparisons. These analytics streamline operations by enabling proactive issue resolution, optimizing route planning, and identifying cost-reduction opportunities, with many logistics companies finding that comprehensive visibility ultimately enhances customer satisfaction while reducing operational expenses. [Word count: 56 words]
UX design significantly impacts logistics dashboard effectiveness by enhancing data visualization, streamlining navigation workflows, and reducing cognitive load for operators. Well-designed interfaces enable faster decision-making in warehouses and distribution centers, minimize training requirements, and improve real-time tracking accuracy, ultimately delivering operational efficiency and reducing costly logistics errors.
Best practices for customizing logistics dashboards include role-based access controls, stakeholder-specific KPI selection, intuitive visual hierarchies, real-time data integration, and mobile optimization. These customizations enhance decision-making by delivering relevant metrics to executives, operations managers, and field teams, while streamlining workflows and enabling faster responses to supply chain disruptions across organizations.
AI and machine learning enhance logistics dashboards by enabling predictive analytics, real-time demand forecasting, automated anomaly detection, and intelligent route optimization. These technologies streamline operations by analyzing vast datasets, identifying patterns, and providing actionable insights, with many logistics companies finding that AI-powered dashboards ultimately deliver faster decision-making and significant cost reductions.
Transportation efficiency metrics include on-time delivery rates, fuel consumption per mile, vehicle utilization percentages, cost per shipment, and average delivery times. These indicators streamline operations by identifying route optimization opportunities, reducing fuel expenses, and improving customer satisfaction, with many logistics companies finding that real-time tracking ultimately delivers significant cost savings and competitive advantage.
A logistics dashboard supports sustainability initiatives by tracking carbon emissions, monitoring fuel consumption, optimizing route efficiency, measuring waste reduction, and analyzing energy usage across supply chain operations. Through real-time data visualization, companies streamline transportation planning, reduce environmental impact, and enhance resource allocation, with many logistics firms finding that these dashboards ultimately deliver cost savings while meeting increasingly strict environmental compliance requirements.
Essential security measures include multi-factor authentication, role-based access controls, end-to-end encryption, regular security audits, and automated threat detection systems. These protocols work together by restricting unauthorized access, protecting data transmission, and monitoring potential vulnerabilities, with many logistics companies finding that layered security approaches ultimately deliver enhanced data protection and regulatory compliance.
Mobile access to logistics dashboards enhances operational agility by enabling real-time decision-making, instant communication with drivers and warehouses, and immediate response to disruptions or delays. Through mobile platforms, logistics managers can monitor shipments, adjust routes, and coordinate resources from anywhere, while field teams receive instant updates, ultimately streamlining operations and delivering faster, more responsive customer service.
Organizations implementing logistics dashboards face challenges including data integration complexity, resistance to change, inadequate training, system compatibility issues, and initial setup costs. However, these obstacles can be overcome through phased implementation approaches, comprehensive staff training programs, and strategic vendor partnerships, with many companies finding that starting with pilot programs in specific departments ultimately delivers smoother transitions and higher adoption rates.
Integrating supplier data into logistics dashboards significantly enhances supply chain visibility by consolidating real-time inventory levels, delivery schedules, performance metrics, and potential disruptions into a unified view. This comprehensive integration enables organizations to proactively identify bottlenecks, optimize procurement decisions, and coordinate responses across multiple suppliers, ultimately delivering improved operational efficiency and reduced supply chain risks.
A logistics dashboard enhances customer satisfaction by providing real-time shipment tracking, delivery notifications, proactive issue alerts, and transparent communication channels throughout the supply chain process. Through automated updates and predictive analytics, companies like e-commerce retailers and manufacturing firms can resolve delays before they impact customers, ultimately delivering faster resolution times, improved delivery accuracy, and enhanced customer experiences that drive loyalty and competitive advantage.
-
The content is very helpful from business point of view.
-
Very well designed and informative templates.