


Market Intelligence And Strategy Development Powerpoint Presentation Slides


Try Before you Buy Download Free Sample Product
 Impress Your
 Audience
Editable
of Time


Market intelligence is a structured compilation and interpretation of information or data about a companys market, its competitors and its customers. The main purpose of gathering information is to make decisions in the areas such as market strategy, market penetration strategy or market development. This presentation will be helpful to the company that wants to introduce its new product in the existing market or to enter in new market. There are seven buckets covered in this presentation namely industry overview, market landscape, competitive intelligence, customer insights, market adoption approach, go to market strategy and performance measurement. Industry overview bucket will help the company to illustrate industry related valuable information such as worldwide spending, trends, drivers, value chain, porters model. After showing the key industry information, company can highlight its market related information through market landscape bucket. With market landscape bucket, company can display its market size, market share, market growth, revenue opportunities, market segmentation and restraints. After providing information about industry and market, company may use competitive intelligence bucket to show its competitor analysis based on technology offerings, features, product, activity and price positioning. Company can also compare its competitors based on revenue model and strategies adopted by them. With Customer Insight section, company can define its customers insights through buyer persona, customer journey map and information about its potential customer. Market adoption approach section shows how company will use the approach covering stages such as diagnose, plan, build and grow to enter in the market or to introduce its new product in the market. Go to market strategy bucket will show the companys product pricing strategy, marketing campaign and market forecast based on market, competitors and customers information. Finally, company can use performance measurement bucket to measure its strategy based on touch-point performance and dashboards.
People who downloaded this PowerPoint presentation also viewed the following :
Content of this Powerpoint Presentation
Slide 1: This slide introduces Market Intelligence and Strategy Development.
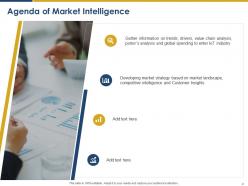
Slide 2: This slide displays Agenda of Market Intelligence.
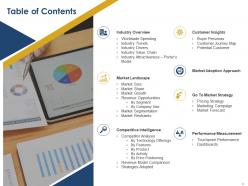
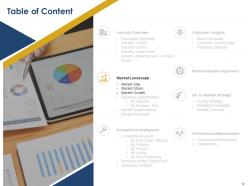
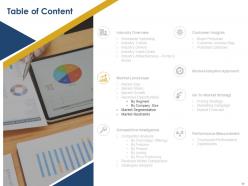
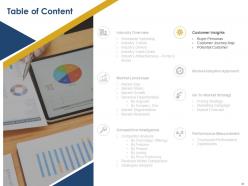
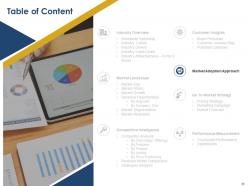
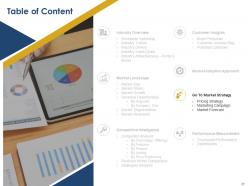
Slide 3: This slide displays Table of Contents.
Slide 4: This slide displays Industry Overview.
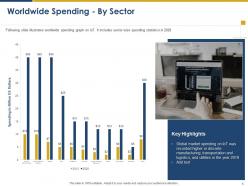
Slide 5: This slide illustrates worldwide spending graph on IoT. It includes sector wise spending statistics in 2020
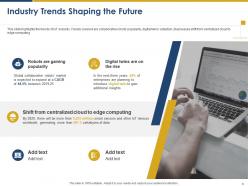
Slide 6: This slide highlights the trends of IoT industry. Trends covered are collaborative robots' popularity, digital twins' adoption, Businesses shift from centralized cloud to
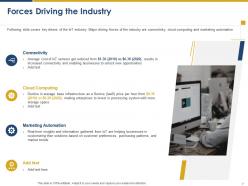
Slide 7: This slide covers key drivers of the IoT industry. Major driving forces of the industry are connectivity, cloud computing and marketing automation
Slide 8: This slide shows Industry Overview.
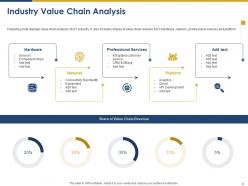
Slide 9: This slide displays value chain analysis of IoT industry. It also includes shares of value chain revenue from hardware, network, professional services and platform
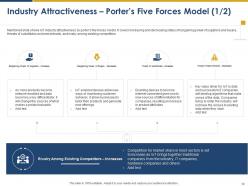
Slide 10: Mentioned slide shows IoT industry attractiveness by porter’s five forces model. It covers increasing and decreasing status of bargaining power of suppliers and buyers, threats of substitutes and new entrants, and rivalry among existing competitors
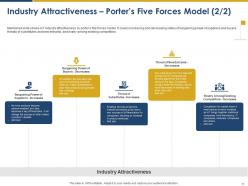
Slide 11: This slide shows IoT industry attractiveness by porter’s five forces model. It covers increasing and decreasing status of bargaining power of suppliers and buyers, threats of substitutes and new entrants, and rivalry among existing competitors
Slide 12: This slide displays Industry Attractiveness – Porter’s Model
Slide 13: This graph demonstrates global market size of IoT Industry. It also shows CAGR rate of IoT industry from 2017 to 2025
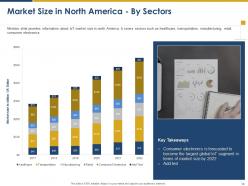
Slide 14: This slide provides information about IoT market size in north America. It covers sectors such as healthcare, transportation, manufacturing, retail, consumer electronics
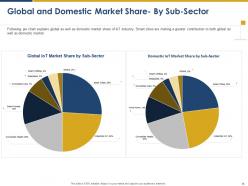
Slide 15: This pie chart explains global as well as domestic market share of IoT industry. Smart cities are making a greater contribution to both global as well as domestic market
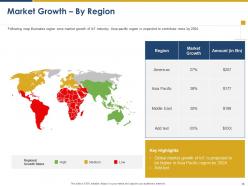
Slide 16: The map in the slide illustrates region wise market growth of IoT industry. Asia pacific region is expected to contribute more by 2024
Slide 17: Industry Attractiveness – Porter’s Model
Slide 18: This slide illustrates statistics of global IoT connections forecast and market revenue by 2025. It also shows region wise connections forecast and share of IoT revenue in platforms, services and connectivity by 2025
Slide 19: This slide display statistics of global IoT by company size. It also shows region wise market revenue forecasting in which Americas region will contribute the most. It also shows the CAGR rate in both IoT use cases and traditional IT use cases in 2018-23
Slide 20: This slide provides detailed information on IoT market segments. Segments covered are components, software and application
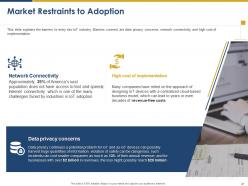
Slide 21: This slide explains the barriers to entry into IoT industry. Barriers covered are data privacy concerns, network connectivity and high cost of implementation
Slide 22: This slide displays Industry Attractiveness – Porter’s Model
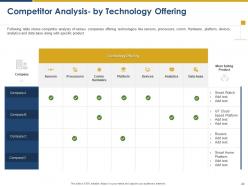
Slide 23: The table shows competitor analysis of various companies offering technologies like sensors, processors, comm. Hardware, platform, devices, analytics and data base along with specific product
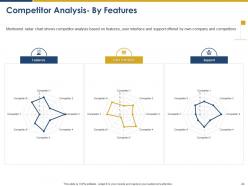
Slide 24: Mentioned radar chart shows competitor analysis based on features, user interface and support offered by own company and competitors
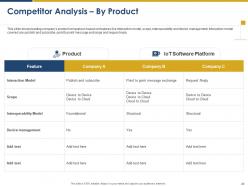
Slide 25: This slide shows leading company’s product comparison based on features like interaction model, scope, interoperability and device management. Interaction model covered are publish and subscribe, point to point message exchange and request reply
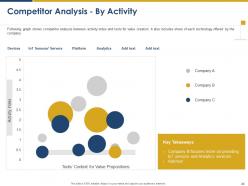
Slide 26: The graph shows competitor analysis between activity index and tools for value creation. It also includes share of each technology offered by the company
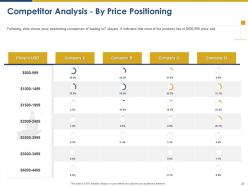
Slide 27: This slide shows price positioning comparison of leading IoT players. It indicates that most of the products lies in $500-999 price slot
Slide 28: This slide shows Table of Content.
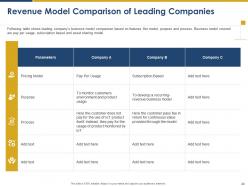
Slide 29: The table shows leading company’s business model comparison based on features like model, purpose and process. Business model covered are pay per usage, subscription based and asset sharing model
Slide 30: This slide shows strategies adopted by leading businesses in IoT industry. Strategies covered are data privacy and variable sensor availability
Slide 31: This slide displays Table of Content.
Slide 32: This slide shows persona profile of buyer with details about the buyer background, how he finds the company, his pain points, what he wants and what he doesn’t and finally why he buys from the company
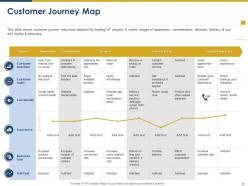
Slide 33: This slide shows customer journey map most adopted by leading IoT players. It covers stages of awareness, consideration, decision, delivery & use and loyalty & advocacy
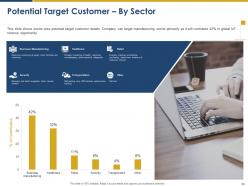
Slide 34: This slide shows sector wise potential target customer details. Company can target manufacturing sector primarily as it will contribute 42% to global IoT revenue opportunity
Slide 35: This slide displays Table of Content.
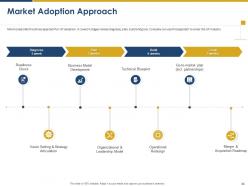
Slide 36: Mentioned slide the shows approach for IoT adoption. It covers 4 stages namely diagnose, plan, build and grow. Company can use this approach to enter the IoT industry
Slide 37: This slide displays Table of Content.
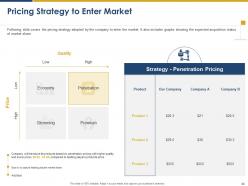
Slide 38: This slide covers the pricing strategy adopted by the company to enter the market. It also includes graphs showing the expected acquisition status of market share
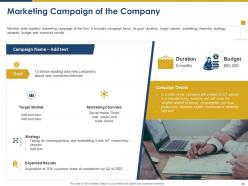
Slide 39: Mention slide explains marketing campaign of the firm. It includes campaign focus, its goal, duration, target market, marketing channels, strategy adopted, budget and expected results
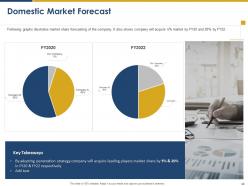
Slide 40: This graphs illustrates market share forecasting of the company. It also shows company will acquire 5% market by FY20 and 20% by FY22.
Slide 41: This slide displays Table of Content
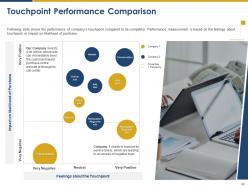
Slide 42: This slide shows the performance of company’s touchpoint compared to its competitor. Performance measurement is based on the feelings about touchpoint vs impact on likelihood of purchase
Slide 43: This slide illustrates sales performance dashboard. It covers sales revenue, sales growth, average revenue per unit, customer lifetime value and customer acquisition cost
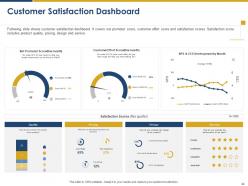
Slide 44: This slide shows customer satisfaction dashboard. It covers net promoter score, customer effort score and satisfaction scores. Satisfaction score includes product quality, pricing, design and service
Slide 45: This is Market Intelligence and Strategy Development Icons Slide
Slide 46: This slide is titled as Additional Slides for moving forward.
Slide 47: This slide displays Our Mission, Vision and Goal.
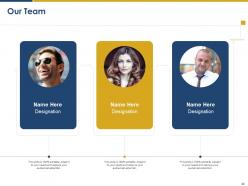
Slide 48: This is Our Team slide with Names and Designations.
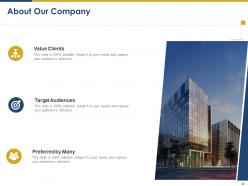
Slide 49: This is About Us slide to showcase Company specifications.
Slide 50: This slide depicts Timeline process.
Slide 51: This is Our Goal slide.
Slide 52: This slide is titled as Post it Notes. Post your important notes.
Slide 53: This is Financial slide.
Slide 54: This is Thank You slide with Names, Contact number and Address.
Market Intelligence And Strategy Development Powerpoint Presentation Slides with all 54 slides:
Use our Market Intelligence And Strategy Development Powerpoint Presentation Slides to effectively help you save your valuable time. They are readymade to fit into any presentation structure.


-
Commendable slides with attractive designs. Extremely pleased with the fact that they are easy to modify. Great work!
-
Very unique and reliable designs.
-
Excellent template with unique design.
-
Topic best represented with attractive design.
-
It saves your time and decrease your efforts in half.