


Metric Dashboard Showcasing Digital Banking E Banking Management And Services




Try Before you Buy Download Free Sample Product
 Impress Your
 Audience
 100%
100% Editable
 Save Hours
 of Time


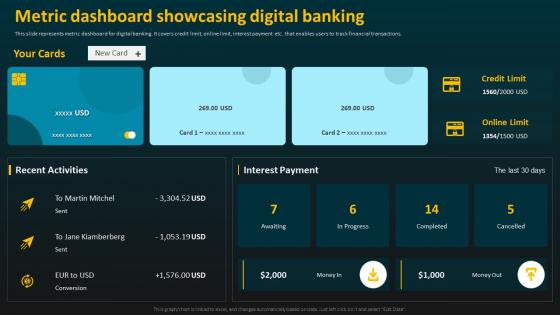
This slide represents metric dashboard for digital banking. It covers credit limit, online limit, interest payment etc. that enables users to track financial transactions.
People who downloaded this PowerPoint presentation also viewed the following :
Metric Dashboard Showcasing Digital Banking E Banking Management And Services with all 6 slides:
Use our Metric Dashboard Showcasing Digital Banking E Banking Management And Services to effectively help you save your valuable time. They are readymade to fit into any presentation structure.





FAQs for Metric Dashboard Showcasing Digital Banking E Banking
A comprehensive metric dashboard should include financial metrics like revenue and profit margins, operational metrics such as customer acquisition cost and conversion rates, performance indicators including employee productivity and customer satisfaction scores, and strategic metrics like market share and competitive positioning. These metrics enable organizations to monitor real-time performance across departments, identify trends quickly, and make data-driven decisions, with many businesses finding that integrated dashboards streamline reporting while delivering enhanced operational visibility and strategic alignment.
A metric dashboard enhances organizational decision-making by centralizing key performance indicators, providing real-time data visualization, and enabling quick identification of trends and anomalies. Through automated reporting and interactive analytics, leaders across departments can monitor operational efficiency, track strategic goals, and respond swiftly to market changes, ultimately delivering faster, more informed decisions and competitive advantage.
Best practices for designing visually appealing metric dashboards include consistent color schemes, clear hierarchical layouts, appropriate chart types, minimal clutter, and strategic white space usage. These design principles enhance user comprehension by prioritizing critical metrics, reducing cognitive load, and enabling faster decision-making, with many organizations finding that well-designed dashboards increase data adoption rates and improve strategic visibility across teams.
Metric dashboards should be updated based on data criticality and business needs, with real-time updates for operational metrics, daily updates for sales and performance data, and weekly or monthly updates for strategic KPIs. Many organizations find that automated refresh schedules, combined with on-demand updates for critical decisions, ultimately deliver the optimal balance between accuracy and system performance.
Commonly used metric dashboard tools include Tableau, Power BI, Google Data Studio, Looker, and Qlik Sense, each offering unique visualization capabilities and integration features. These platforms streamline data analysis by connecting multiple sources, automating reporting processes, and enabling real-time monitoring, with many organizations finding that strategic dashboard implementation enhances decision-making speed and operational transparency.
Organizations ensure data integrity and reliability through automated data validation, real-time monitoring systems, standardized data sources, regular audit protocols, and role-based access controls. These approaches streamline accuracy by eliminating manual errors, detecting anomalies instantly, and maintaining consistent metrics across departments, with many financial services and healthcare institutions finding that robust validation frameworks ultimately deliver trustworthy insights and confident decision-making.
KPIs serve as the foundational framework for metric dashboards, defining which data points to track, how to measure performance against objectives, and what thresholds trigger actionable insights. These key performance indicators enable organizations to transform raw data into strategic intelligence, with companies across retail, healthcare, and manufacturing finding that well-defined KPIs streamline decision-making and ultimately deliver measurable competitive advantage.
Metric dashboards can be customized through department-specific KPIs, tailored visualizations, role-based access controls, personalized data filters, and automated reporting schedules. For example, sales teams focus on conversion rates and pipeline metrics, while HR departments track employee engagement and retention data, with each dashboard delivering relevant insights that enhance decision-making and operational efficiency across organizational functions.
Integrating multiple data sources into dashboards presents challenges including data format inconsistencies, varying update frequencies, security protocols, system compatibility issues, and real-time synchronization requirements. These technical hurdles often require strategic data mapping, API integrations, and middleware solutions, with many organizations finding that investing in robust data governance frameworks ultimately streamlines operations and delivers more accurate business insights.
Metric dashboards track strategic goal progress by consolidating key performance indicators, providing real-time visibility into outcomes, and enabling data-driven decision making across organizational levels. Through automated reporting and visual analytics, leadership teams can monitor revenue targets, operational efficiency metrics, and customer satisfaction scores, while identifying performance gaps early and adjusting strategies accordingly to maintain competitive advantage.
Real-time data in metric dashboards enables instant decision-making, proactive issue identification, enhanced operational visibility, improved customer responsiveness, and competitive advantage through immediate insights. These capabilities streamline performance monitoring by eliminating data delays, accelerating problem resolution, and optimizing resource allocation, with many organizations finding that real-time visibility ultimately delivers faster response times and significantly improved business outcomes.
User feedback shapes metric dashboard evolution by identifying missing KPIs, highlighting visualization preferences, revealing workflow inefficiencies, and pinpointing data accessibility issues. Through surveys, usage analytics, and stakeholder interviews, organizations can prioritize features that enhance decision-making speed, reduce manual reporting tasks, and improve data comprehension, ultimately delivering dashboards that align with actual business needs rather than assumptions.
Strategies include gamifying performance metrics, conducting regular dashboard review sessions, providing comprehensive training on data interpretation, establishing clear accountability frameworks, and creating personalized views for different roles. Through interactive features and real-time alerts, organizations streamline decision-making processes while enhancing transparency, with many teams finding that visual data storytelling ultimately delivers improved performance outcomes and stronger collaborative focus.
Mobile-responsive metric dashboards enhance user accessibility by automatically adapting layouts, optimizing touch interactions, and ensuring readability across different screen sizes and devices. These dashboards enable executives, field teams, and remote workers to monitor KPIs seamlessly from smartphones and tablets, ultimately delivering real-time decision-making capabilities and improved operational efficiency regardless of location.
Industries that significantly benefit from metric dashboards include healthcare, retail, manufacturing, financial services, and logistics. These dashboards enable hospitals to track patient outcomes and resource utilization, help retailers monitor sales performance and inventory levels, and allow manufacturers to streamline production efficiency, ultimately delivering enhanced operational transparency and faster decision-making across organizations.
-
I joined SlideTeam last month and there’s no doubt that I tend to find our bond only strengthening over time. Best place to find world-class themes, templates, and icons.
-
Graphics are very appealing to eyes.