


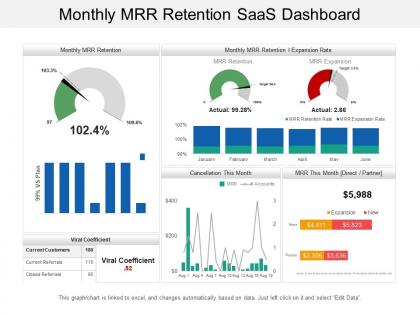
Monthly mrr retention saas dashboard




Try Before you Buy Download Free Sample Product
 Impress Your
 Audience
 100%
100% Editable
 Save Hours
 of Time


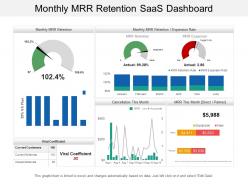
Download our monthly MRR retention Saas dashboard presentation slide and build a faster and more efficient way of retaining your customers. Our monthly MRR retention Saas dashboard PowerPoint template has been designed with beautiful colors and charts highlighting the concept of customer retention. Working without a proper project plan will not serve any of your business goals. It is very important to have a well-defined customer retention dashboard that will help you set clear priorities and directions for your business. If you want to run your business smoothly then you have to track metrics like customer cancellations, contractions, and expansions. Each metric is a key to understanding how you will perform on your MRR targets for any given month. So, use our monthly MRR retention saas dashboard presentation diagram and focus on acquisition need to keep your customer retention metrics on top of your mind. Insert the slide now. In today's business world design makes or breaks deals. Make sure yours aren't being left in the dust with high quality Monthly Mrr Retention Saas Dashboard for your next presentation.
People who downloaded this PowerPoint presentation also viewed the following :
Monthly mrr retention saas dashboard with all 6 slides:
Cater for the infirm with our Monthly Mrr Retention Saas Dashboard. Create conditions conducive to them.



FAQs for Monthly mrr
A Monthly MRR Retention SaaS Dashboard should include gross MRR retention, net MRR retention, churn rate, expansion MRR, contraction MRR, customer lifetime value, and cohort analysis. These metrics enable SaaS companies to identify revenue patterns, predict growth trajectories, and optimize retention strategies, with many organizations finding that comprehensive dashboards ultimately enhance customer success initiatives and sustainable revenue growth.
Data visualization enhances MRR retention understanding by transforming complex subscription data into clear charts, graphs, heat maps, and cohort analyses that reveal patterns, seasonal trends, and churn indicators at a glance. These visual tools enable SaaS companies to quickly identify revenue leaks, track customer lifecycle stages, and benchmark performance metrics, ultimately delivering faster decision-making and more strategic retention initiatives.
**INPUT**: What are the best practices for calculating customer lifetime value (CLV) in relation to MRR retention? **OUTPUT**: Best practices for calculating CLV with MRR retention include using cohort-based analysis, incorporating churn probability models, adjusting for expansion revenue, and factoring in retention improvements over time. These approaches enable SaaS companies to accurately predict revenue streams, optimize customer acquisition costs, and identify high-value segments, with many organizations finding that retention-focused CLV calculations deliver more strategic pricing and investment decisions.
Churn analysis integrates into Monthly MRR Retention Dashboards through cohort tracking, segmentation by customer type, retention curves, and predictive risk scoring. These analytical components enable SaaS companies to identify at-risk accounts, understand revenue impact patterns, and implement targeted retention strategies, ultimately delivering proactive customer success management and improved long-term subscription value.
Cohort analysis tracks MRR retention by grouping customers based on their subscription start dates, revealing how different customer segments behave over time and identifying patterns in churn, expansion, and contraction. This approach enables SaaS companies to pinpoint which acquisition periods, pricing strategies, or product features drive stronger retention, ultimately delivering actionable insights for improving customer lifetime value and revenue predictability.
SaaS companies should update their Monthly MRR Retention Dashboard daily for real-time accuracy, with comprehensive monthly reconciliations to ensure data integrity and strategic alignment. This frequency enables organizations to quickly identify churn patterns, revenue fluctuations, and retention trends, while monthly deep-dives facilitate strategic planning and forecasting, ultimately delivering competitive advantage through responsive customer success initiatives.
Effective tools for building Monthly MRR Retention SaaS Dashboards include Tableau, Power BI, ChartMogul, ProfitWell, and Looker, which integrate seamlessly with CRM and billing systems. These platforms streamline data visualization by automating retention calculations, tracking cohort performance, and delivering real-time insights, with many SaaS companies finding that comprehensive dashboards enhance strategic decision-making and accelerate growth optimization efforts.
SaaS companies can use historical MRR data to forecast retention rates by analyzing churn patterns, cohort performance, seasonal trends, customer lifecycle stages, and revenue concentration metrics. Through predictive analytics and machine learning algorithms, organizations identify at-risk segments, optimize pricing strategies, and proactively address retention challenges, ultimately delivering more accurate revenue forecasts and strategic resource allocation decisions.
Customer segmentation techniques for Monthly MRR Retention Dashboards include cohort analysis, revenue tiers, subscription plans, geographic regions, and customer lifecycle stages. These segmentation methods enhance retention analysis by identifying at-risk customer groups, comparing performance across different segments, and enabling targeted retention strategies, with many SaaS companies finding that segmented dashboards deliver more actionable insights and improved churn prevention.
Customer feedback and support ticket data enhance MRR retention strategies by identifying at-risk accounts, revealing product improvement opportunities, and enabling proactive intervention campaigns. Through integrated analytics, SaaS companies streamline customer success workflows, automate retention alerts based on satisfaction scores, and personalize renewal approaches, with many organizations finding that combining support insights with financial metrics ultimately delivers improved retention rates and reduces churn-related revenue loss.
Upselling and cross-selling significantly enhance MRR retention by increasing customer lifetime value, reducing churn risk through deeper product engagement, and creating stronger switching barriers. These efforts should be tracked through expansion revenue metrics, customer cohort progression analysis, and retention rate improvements by customer segment, with many SaaS companies finding that customers using multiple products show 40-60% higher retention rates.
SaaS firms can measure retention campaign effectiveness through their MRR Retention Dashboard by tracking cohort-based retention rates, churn reduction percentages, expansion revenue growth, and campaign-specific MRR recovery metrics. These dashboards enable companies to analyze retention trends across customer segments, identify successful intervention strategies, and quantify campaign ROI, ultimately delivering measurable improvements in customer lifetime value and sustainable revenue growth.
Automation improves MRR retention reporting by eliminating manual data entry, providing real-time metric updates, generating automated alerts for churn patterns, and creating scheduled reports with predictive analytics. These capabilities streamline operations by reducing human error, accelerating decision-making processes, and enabling proactive retention strategies, with many SaaS organizations finding that automated dashboards deliver faster insights and significantly improved customer lifecycle management.
Seasonality affects MRR retention through predictable fluctuations in customer behavior, renewal patterns, and usage cycles, requiring dashboard representation through year-over-year comparisons, seasonal trend overlays, and rolling averages. SaaS companies increasingly implement dynamic visualizations that highlight seasonal baselines, comparative cohort analysis, and adjusted retention benchmarks, enabling strategic resource allocation during peak and low periods while maintaining accurate performance measurement across varying business cycles.
Negative MRR signals critical business health issues including unsustainable unit economics, customer satisfaction problems, pricing misalignment, and potential cash flow constraints that require immediate strategic intervention. Effective dashboard visualization should prominently display MRR trends with clear downward indicators, churn rate breakdowns by customer segments, and actionable metrics like net revenue retention, enabling stakeholders to quickly identify problem areas and implement targeted retention strategies.
No Reviews