


Operating cost comparison analysis labor ppt powerpoint presentation infographic template images




Try Before you Buy Download Free Sample Product
 Impress Your
 Audience
 100%
100% Editable
 Save Hours
 of Time


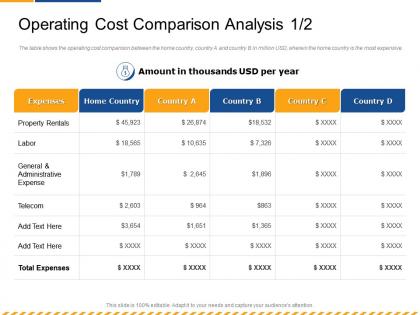
The table shows the operating cost comparison between the home country, country A and country B in million USD, wherein the home country is the most expensive.
People who downloaded this PowerPoint presentation also viewed the following :
Operating cost comparison analysis labor ppt powerpoint presentation infographic template images with all 2 slides:
Use our Operating Cost Comparison Analysis Labor Ppt Powerpoint Presentation Infographic Template Images to effectively help you save your valuable time. They are readymade to fit into any presentation structure.
FAQs for Operating cost comparison analysis labor ppt powerpoint presentation
So it really depends on what industry you're looking at, but generally labor and materials are gonna be your biggest hits. Manufacturing gets crushed by raw material costs and energy bills. Service companies like consulting? Almost all labor costs plus whatever they're paying for office space. Healthcare's honestly a mess - you've got expensive equipment, drugs, plus all those specialists who cost a fortune. Retail's weird because it's split between inventory and prime real estate (gotta love those mall rents, right?). When you're comparing, just focus on the top 3-4 expense categories since they'll usually make up like 70-80% of everything anyway.
Okay so first thing - split your expenses into fixed and variable. Fixed stuff like rent and salaries stays the same no matter what. Variable costs (materials, shipping, etc.) change based on how much you're producing. Grab your last year of financial records and go through everything line by line. Yeah, it's tedious but you gotta do it. Some costs are weird middle-ground cases, but don't stress too much about those at first. For variable costs, just use your historical averages and multiply by whatever volume you're projecting. Track this stuff monthly so you can catch patterns. Honestly, if you hit 80% accuracy starting out, that's pretty solid - you can always tweak it later.
Tech can seriously cut your costs if you use it right. Automates all that boring repetitive stuff and gets rid of expensive human mistakes. I've seen companies save 20-30% just by switching to cloud computing - those numbers are honestly crazy when you actually crunch them. Focus on data processing, chatbots for customer service, and workflows that usually take forever to do manually. Here's what I'd do: figure out what's eating most of your time and money, then find tech that handles it faster and cheaper. Oh, and definitely tackle your biggest headaches first.
Dude, supply chain stuff can totally mess with your costs - goes both ways though. Better supplier deals and smoother logistics? Your expenses drop fast. But here's the thing - you'll probably spend money upfront on new systems first, which sucks. Bad supply chain moves are brutal: extra inventory costs, crazy rush shipping, supplier penalties pile up. I learned this the hard way at my last job actually. Track your cost per unit and delivery times before changing anything. Otherwise you're just moving money around instead of actually saving it.
Check out IBISWorld or your industry's trade associations first - they've got tons of cost ratios and benchmarking data. S&P Capital IQ is solid for comparing against similar companies too. Honestly, don't underestimate just talking to people at conferences or industry meetups. You'd be surprised how much you can learn over a beer. There are also specialized benchmarking services, but those cost money obviously. The main thing is making sure you're comparing apples to apples - same size companies, similar locations, that kind of stuff. I'd start with the free industry reports and see what you find there.
Oh man, seasonal stuff can really screw up your cost analysis - I've seen it happen so many times. Retail and hospitality get hit the worst. Like, your labor costs explode during holidays when you're hiring temporary workers, then energy bills are all over the place depending on if you're blasting heat or AC. Agriculture's probably even crazier with their seasonal swings. What works is looking at a full 12 months instead of just quarters. That way you smooth out all the crazy peaks and actually see what's normal vs. what's just seasonal noise.
Start with the boring stuff that happens every day - automation saves you tons without screwing up quality. Check your vendor contracts too, I bet you're getting ripped off somewhere. Cross-training is actually pretty smart since people enjoy learning new things (and you won't be stuck when your "expert" goes on vacation). Those energy efficiency upgrades are super dull but honestly? The savings stack up fast. Here's the thing though - track everything for like 3 months first so you actually know where your cash disappears. Pick one thing, see what happens, then tackle the next.
Look at your department costs and stack them against industry benchmarks or what you spent last year. Big differences? That's where you focus. Start with the fattest cost buckets - don't waste time tweaking stuff that's already working fine. Procurement costs way above everyone else's? Red flag. Dig into the why though - could be old systems, duplicate work, or maybe you just suck at negotiating with vendors (happens to the best of us). Then rank which fixes to tackle first based on how much you'll save vs how painful it'll be to implement.
Honestly, start with cost per unit - that's your bread and butter right there. You'll also want operating margin percentage and year-over-year cost variance. Those three cover most of what you need. Oh, and definitely track cost-to-revenue ratio because executives are obsessed with that one for some reason. Breaking down costs by category helps too - labor, materials, overhead, all that stuff. Makes it way easier to figure out where things are going wrong. Operating expense ratios are decent for comparing yourself to competitors, but don't stress about those initially. Focus on cost per unit first since it actually shows if you're getting more efficient.
Look, I know training feels like throwing money away upfront, but it actually saves you cash long-term. Your turnover drops. Fewer dumb mistakes that cost time to fix. Workers get more done without you babysitting them constantly. Honestly? The biggest surprise is how much you save on not having to outsource stuff - trained people can handle way more complex things. Track your current costs from turnover and screw-ups first, then compare that to what training would cost. The math usually works out better than you'd think, especially if retention is already an issue.
Regulatory changes can totally wreck your operating costs - we're talking millions in new compliance expenses sometimes. Safety, environmental, and data privacy rules hit the fastest since you need new systems and training right away. Healthcare and finance companies? They get absolutely destroyed by this stuff, honestly. But here's what's tricky - it's not just the obvious costs you need to worry about. These changes mess with your whole competitive setup too, affecting what you can charge and your market position. Oh, and deregulation can actually save money sometimes. Track both the direct compliance hits and those sneaky indirect effects on your business model.
Honestly, you've got to stress-test your cost strategies monthly - run scenarios for market crashes, inflation spikes, supply chain mess, all that nightmare fuel. Pick 3-4 situations that would genuinely freak you out and crunch those numbers. Track your variable-to-fixed cost ratios and see how you stack up against competitors every quarter. Here's the kicker though - model what happens when revenue tanks 20-30%. That's where most companies get blindsided. Set up warning flags for when cost categories hit certain percentages of revenue. Trust me, it's way better than scrambling when things actually hit the fan.
Honestly, outsourcing can save you a ton of money if you do it right. Instead of paying full-time salaries, benefits, and all that overhead stuff, you're just paying for the service when you need it. The companies you outsource to usually have better deals with suppliers and can do things cheaper than you could in-house - which is annoying but also helpful lol. I'd focus on outsourcing the stuff that takes forever but isn't really what makes your business special. Just don't go with the cheapest option or you'll regret it later. Look at what's eating up most of your time and money first.
Honestly, most companies just ignore the cost data they're already collecting - it's crazy. Track your big expenses over time: labor, materials, overhead. Look for weird spikes or patterns you wouldn't notice day-to-day. I'd set up some basic dashboards to watch key metrics in real-time, maybe use predictive stuff to forecast what's coming based on your history. The part that actually moves the needle? Compare your costs to industry benchmarks or how you performed last year. Do a monthly review with these insights and you'll catch inefficiencies you never would've spotted manually.
You'll probably cut muscle with the fat - like axing teams that actually make you money or keep customers happy. Honestly, I've watched companies gut their R&D thinking they're being smart, then competitors just waltz in and steal market share. Short-term savings can wreck your long-term growth, which sucks. Plus your culture gets weird when everyone's scared to innovate because they think everything's about cutting costs. My take? Connect your cuts to actual strategic goals instead of just hitting some random percentage target your CFO threw out there.
-
The Designed Graphic are very professional and classic.