


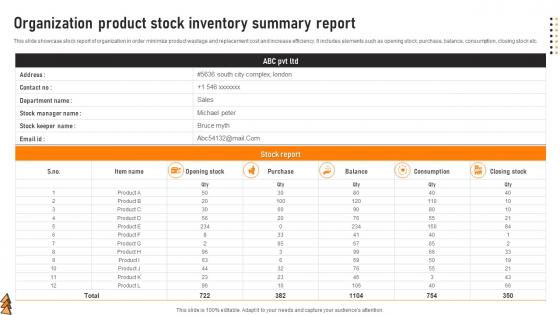
Organization Product Stock Inventory Summary Report




Try Before you Buy Download Free Sample Product
 Impress Your
 Audience
 100%
100% Editable
 Save Hours
 of Time


This slide showcase stock report of organization in order minimize product wastage and replacement cost and increase efficiency. It includes elements such as opening stock, purchase, balance, consumption, closing stock etc.
People who downloaded this PowerPoint presentation also viewed the following :
Organization Product Stock Inventory Summary Report with all 6 slides:
Use our Organization Product Stock Inventory Summary Report to effectively help you save your valuable time. They are readymade to fit into any presentation structure.





FAQs for Organization Product Stock
**INPUT**: What key metrics should be included in an effective inventory report? **OUTPUT**: Effective inventory reports should include stock levels, turnover rates, carrying costs, lead times, stockout frequencies, and demand forecasting accuracy. These metrics enable organizations to streamline operations, minimize holding costs, and optimize reorder points, with many retail and manufacturing companies finding that comprehensive tracking ultimately delivers improved cash flow and enhanced customer satisfaction. **Word count: 54 words**
Businesses leverage inventory reports to improve supply chain management by identifying demand patterns, optimizing stock levels, and reducing carrying costs through data-driven insights. These reports enable companies to streamline procurement processes, minimize stockouts and overstock situations, and enhance vendor relationships, with many organizations finding that automated inventory tracking ultimately delivers faster order fulfillment and improved customer satisfaction.
Automated inventory reporting tools deliver real-time accuracy, reduced human error, streamlined data collection, enhanced forecasting capabilities, and significant time savings compared to manual methods. These systems enable retailers, manufacturers, and distributors to optimize stock levels, minimize carrying costs, and improve customer satisfaction, while freeing staff for strategic tasks rather than data entry.
Companies should generate inventory reports weekly for fast-moving items, monthly for standard products, and quarterly for slow-moving stock, while high-volume retailers often require daily reporting. This strategic frequency enables businesses to minimize carrying costs, prevent stockouts, and optimize cash flow, with many organizations finding that automated reporting systems deliver real-time visibility and competitive advantage.
Real-time data ensures inventory reports reflect current stock levels, movement patterns, demand fluctuations, and supply chain disruptions as they occur. This immediate visibility enables businesses to make informed decisions about restocking, reduce stockouts, and optimize warehouse operations, with many retailers and manufacturers finding that real-time tracking significantly improves accuracy and operational efficiency.
Seasonal trends significantly impact inventory reporting by creating predictable demand fluctuations, requiring adjusted reorder points, modified safety stock levels, and enhanced forecasting models. Retailers and manufacturers increasingly rely on seasonal data analysis to optimize purchasing cycles, minimize excess inventory during off-peak periods, and ensure adequate stock for high-demand seasons, ultimately delivering improved cash flow and customer satisfaction.
Common inventory report challenges include data accuracy inconsistencies, manual tracking errors, real-time visibility gaps, system integration difficulties, and reconciliation discrepancies across multiple locations. These obstacles often result in stock shortages, overstock situations, and delayed decision-making, with many retail and manufacturing organizations finding that automated inventory management systems significantly streamline reporting processes while enhancing operational efficiency.
Inventory reports assist in forecasting by analyzing historical consumption patterns, seasonal trends, lead times, and demand fluctuations to predict future requirements. These insights enable businesses to optimize procurement schedules, minimize stockouts and overstock situations, and maintain optimal inventory levels, with retailers and manufacturers finding that accurate forecasting reduces carrying costs while ensuring product availability.
Best practices for presenting inventory reports include clear data visualization, executive summaries highlighting key metrics, trend analysis with actionable insights, consistent formatting across reporting periods, and stakeholder-specific customization. These approaches streamline decision-making by emphasizing critical inventory levels, cost implications, and operational efficiency, with many organizations finding that well-structured presentations ultimately enhance strategic planning and resource allocation.
Inventory reports help identify slow-moving or obsolete items by tracking turnover rates, aging analysis, and demand patterns over specific periods. Through automated data analytics, businesses can pinpoint products with declining sales velocity, excessive holding periods, or seasonal fluctuations, enabling strategic decisions about markdowns, liquidation, or discontinuation while optimizing warehouse space and cash flow.
Inventory reports should incorporate key accounting principles including cost principle, matching principle, conservatism, materiality, and consistency in valuation methods. These principles ensure accurate financial reporting by establishing proper cost recognition, aligning expenses with revenues, and maintaining standardized inventory valuation approaches, with many organizations finding that consistent application ultimately delivers enhanced financial transparency and regulatory compliance.
Businesses ensure inventory reporting accuracy through regular cycle counts, automated inventory management systems, barcode scanning technology, real-time tracking integration, and standardized data entry protocols. These approaches streamline operations by minimizing human error, enhancing visibility across warehouses, and enabling faster decision-making, with many retailers and manufacturers finding that automated systems reduce discrepancies while improving operational efficiency.
Visual aids enhance inventory report presentations by improving data comprehension, highlighting critical trends, enabling quick variance identification, and facilitating faster decision-making through charts, graphs, and dashboards. These tools streamline complex inventory data into digestible formats, with many retail and manufacturing organizations finding that visual presentations reduce analysis time and improve stakeholder engagement significantly.
Inventory reporting significantly impacts financial statements through cost of goods sold calculations, balance sheet accuracy, and profit margins, while influencing cash flow management and tax obligations. Accurate inventory data enables businesses to optimize working capital, identify slow-moving stock, and make strategic purchasing decisions, with many retailers and manufacturers finding that precise reporting ultimately delivers better financial forecasting and operational efficiency.
Organizations can tailor inventory reports by incorporating industry-specific metrics, compliance requirements, regulatory standards, and operational KPIs relevant to their sector. Manufacturing companies focus on raw materials and work-in-progress tracking, while retail emphasizes turnover rates and seasonal demand patterns, ultimately enabling better strategic decisions and enhanced operational efficiency.
-
I had them make a presentation for an office retirement party. They were very helpful in understanding what we wanted and delivered the perfect presentation. Highly recommended!
-
Fantastic and innovative graphics with useful content. The templates are the best and latest in the industry.