


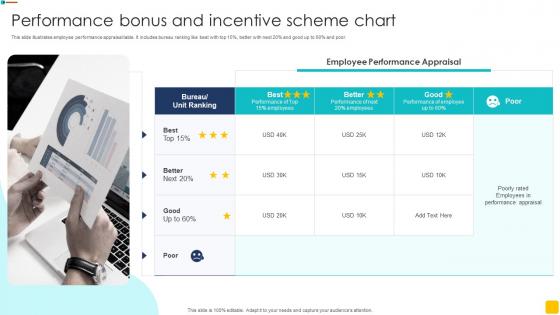
Performance Bonus And Incentive Scheme Chart




Try Before you Buy Download Free Sample Product
 Impress Your
 Audience
 100%
100% Editable
 Save Hours
 of Time


This slide illustrates employee performance appraisal table. It includes bureau ranking like best with top 15 percent, better with next 20 percent and good up to 60 percent and poor.
People who downloaded this PowerPoint presentation also viewed the following :
Performance Bonus And Incentive Scheme Chart with all 6 slides:
Use our Performance Bonus And Incentive Scheme Chart to effectively help you save your valuable time. They are readymade to fit into any presentation structure.





FAQs for Performance Bonus And
Performance bonus charts should include clear performance metrics, corresponding bonus percentages or amounts, threshold levels for qualification, measurement periods, and payout timelines. These elements work together by establishing transparent expectations, linking compensation directly to measurable outcomes, and providing employees with actionable goals, ultimately enhancing motivation while ensuring organizational alignment and performance accountability.
Performance bonus charts can be customized by adjusting metrics, weighting criteria, payout structures, and evaluation periods to align with specific industry requirements and business objectives. Financial services might emphasize client acquisition and risk management, while manufacturing focuses on safety records and production efficiency, with many organizations finding that tailored charts drive better performance alignment and employee engagement.
Data visualization transforms performance bonus charts by incorporating interactive dashboards, color-coded progress bars, comparative benchmarks, and real-time tracking elements that make complex compensation data immediately accessible. These visual enhancements streamline employee understanding while enabling managers to communicate achievement levels more effectively, ultimately delivering greater transparency and motivation across organizations seeking to optimize their performance management systems.
Organizations ensure transparency in bonus calculations by clearly displaying calculation formulas, performance metrics, weightings, and threshold requirements directly within the chart framework. Through standardized visualization methods, companies can present individual performance scores, team comparisons, and payout structures, while providing accessible explanations of criteria, ultimately building employee trust and enabling better performance alignment across departments.
Common mistakes include unclear metrics, unrealistic targets, overcomplicating the structure, inadequate communication, and failing to align bonuses with company objectives. These design flaws undermine employee motivation by creating confusion, frustration, and misaligned incentives, with many organizations finding that overly complex systems reduce transparency and ultimately diminish the chart's effectiveness in driving performance.
Performance metrics can be effectively represented through clear goal thresholds, achievement percentages, payout scales, visual progress indicators, and comparative benchmarks. These charts streamline compensation decisions by displaying individual performance against targets, team rankings, and bonus calculations, with many organizations finding that transparent visual representations enhance employee motivation while simplifying administrative processes.
**INPUT**: What software or tools are recommended for creating professional performance bonus charts? **OUTPUT**: Recommended tools include Microsoft Excel, Tableau, Power BI, Google Sheets, and specialized presentation software like SlideTeam's templates. These platforms streamline chart creation by offering customizable templates, automated calculations, and professional formatting options, with many organizations finding that combining spreadsheet functionality with presentation tools ultimately delivers more compelling visual communications and enhanced stakeholder engagement.
Historical data can be integrated into performance bonus charts through trend lines, year-over-year comparisons, rolling averages, and baseline performance indicators. These visualizations enable organizations to track employee progression patterns, identify seasonal performance variations, and benchmark current achievements against historical standards, ultimately delivering more strategic compensation decisions and enhanced employee development insights.
Effective KPIs for bonus determination include revenue growth, customer satisfaction scores, operational efficiency metrics, quality benchmarks, and individual goal achievement rates. These indicators work best when combining quantitative measures like sales targets with qualitative assessments, with many organizations finding that balanced scorecards linking performance directly to strategic objectives deliver the most meaningful and motivating compensation outcomes.
Employee feedback influences performance bonus chart design by identifying valued rewards, preferred recognition methods, and perceived fairness gaps in current systems. Through surveys and focus groups, organizations can align bonus structures with employee motivations, adjust payout thresholds, and incorporate diverse incentive types, ultimately delivering more effective compensation strategies that enhance retention and performance across teams.
Innovative performance bonus chart designs include interactive dashboards with real-time tracking, gamified progress bars with achievement levels, heat maps showing departmental comparisons, milestone-based visual timelines, and personalized scorecards with multiple KPI categories. These dynamic approaches enhance employee engagement by providing clear transparency, immediate feedback recognition, and competitive motivation, ultimately driving higher performance outcomes and retention across organizations.
A performance bonus chart supports employee motivation by creating transparent reward structures, establishing clear performance metrics, and linking compensation directly to achievements and results. These visual tools enhance engagement by providing regular feedback, recognizing top performers publicly, and creating healthy competition, with many organizations finding that transparent bonus systems ultimately drive higher productivity and employee retention rates.
Legal considerations include compliance with labor laws, equal pay regulations, tax reporting requirements, documentation standards, and anti-discrimination policies. These frameworks ensure transparency by establishing clear criteria, maintaining consistent evaluation processes, and providing proper documentation, with many organizations finding that structured bonus systems reduce legal risks while enhancing employee trust and regulatory compliance.
Cultural differences significantly impact performance bonus chart interpretation through varying attitudes toward individual versus collective recognition, hierarchical transparency expectations, and reward communication styles. Organizations operating globally find that while Western cultures often favor direct individual performance displays, many Asian and Latin cultures prefer team-based recognition formats, requiring culturally adaptive chart designs that balance transparency with cultural sensitivity to maximize employee engagement.
Businesses can measure bonus structure effectiveness using performance trend charts, ROI analysis graphs, employee retention metrics, productivity correlation charts, and cost-per-performance visualizations. These analytical tools enable organizations to track bonus impact on revenue growth, employee engagement levels, and operational efficiency, with many companies finding that data-driven bonus structures deliver improved performance outcomes and enhanced competitive advantage.
-
I can always count on your designs for my professional needs. I believe I found a one-stop-shop for PPTs.
-
Wonderful ideas and visuals. I'm really pleased with the templates, which are unique and up to date.