

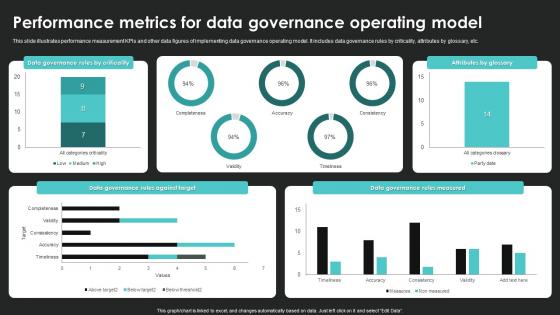
Performance Metrics For Data Governance Operating Model




Try Before you Buy Download Free Sample Product
 Impress Your
 Audience
 100%
100% Editable
 Save Hours
 of Time


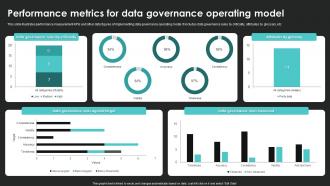
This slide illustrates performance measurement KPIs and other data figures of implementing data governance operating model. It includes data governance rules by criticality, attributes by glossary, etc.
People who downloaded this PowerPoint presentation also viewed the following :
Performance Metrics For Data Governance Operating Model with all 7 slides:
Use our Performance Metrics For Data Governance Operating Model to effectively help you save your valuable time. They are readymade to fit into any presentation structure.





FAQs for Performance Metrics For Data
Honestly, I'd focus on revenue growth rate, CAC, and CLV as your big three. Churn rate is huge too - way cheaper to keep customers than find new ones. If you're doing subscriptions, MRR is obviously key. Don't forget gross margins and cash flow though. Growth means nothing if you're bleeding money, right? I made that mistake early on actually. Keep it to maybe 5-7 metrics max or you'll drown in spreadsheets. Set up monthly tracking with a basic dashboard so you can catch problems before they get ugly.
Honestly, I'd map your business goals to actual measurable stuff first - that's where you start. Work backwards from there to find metrics that actually matter, not just the easy ones to track. Way too many people obsess over vanity metrics that look cool but don't change anything. Leading indicators are where it's at since they predict what's coming instead of just telling you what already went down. Oh, and definitely do regular check-ins because priorities shift constantly. Everyone needs to see how their daily grind connects to the bigger picture or they'll just phone it in.
Okay so basically qualitative metrics explain the "why" behind your data. Your conversion rate drops 15%? That's just a number. But user feedback might tell you the new checkout process is totally confusing people. Numbers show you *something* happened - qualitative stuff from surveys or interviews reveals what users were actually thinking. I learned this the hard way when our team couldn't figure out why engagement tanked until we started asking people directly. Always use both together though. The qualitative insights help you understand the emotions and reasons driving those number changes.
Check out your competitors' investor calls and annual reports first - they're basically giving away their playbook. Industry associations usually publish benchmarking studies too. Honestly? Don't get crazy with this at the start. Pick 3-5 metrics that actually connect to how you make money and what customers do. You can always change course later. Talk to some industry vets if you know any - they've seen what works across different companies. I'd rather go deep on fewer metrics than track everything poorly. Way better insights that way.
Weekly check-ins are your best bet, honestly. Daily's great for stuff like sales or web traffic that changes fast. Monthly deep dives help you actually adjust things that matter. Quarterly reviews? Way too slow these days - you'll miss everything. Focus on maybe 3-5 metrics that actually matter for your business, not just vanity numbers. Set up some automated dashboards so you're not constantly pulling reports like it's 2005. The weekly rhythm catches problems early, then monthly you can pivot if needed. Trust me, it sounds like overkill but it's not.
Google Analytics is your best bet for web stuff, then grab Tableau or Power BI for dashboards that don't make your eyes bleed. Look, I've watched teams blow their budgets on crazy expensive tools when honestly? Excel works fine if you're just starting out. Mixpanel's great for app tracking - my buddy swears by it. But here's the thing: pick ONE tool and actually learn it inside out. Don't be that person hopping around trying every shiny new platform. Start with whatever your team's already using, then build from there.
Get your team involved in building the metrics from scratch - they'll actually care about hitting targets they helped create. I've seen this work so much better than the top-down approach most places use. Make sure you're tracking progress and learning, not just pass/fail stuff. Nobody wants to feel like they're bombing constantly. Two-way feedback works way better than those awkward one-sided reviews too. Be super transparent about why you're measuring things and how it benefits everyone. Short version: make it feel like coaching, not surveillance.
Dashboards are seriously your best bet here - Tableau, Power BI, or Google Data Studio all let you build interactive stuff that updates automatically. Heat maps work really well when you're comparing performance across different areas. For tracking changes over time, trend lines are clutch. Honestly though, I've seen people overthink this and create these crazy complex visuals when a basic bar chart would've been way clearer. Think about who's gonna see it first, then pick whatever tells the story best. Oh, and definitely run it by someone else before you present - I learned that one the hard way!
So metrics basically give you different views depending on where you sit in the company. Executives care about the big stuff - revenue growth, market share - for setting overall strategy. Middle managers? They're tracking things like conversion rates to figure out where to spend their budget. Frontline folks focus on daily numbers to put out fires. The tricky part is getting all these metrics to actually work together (which honestly most companies suck at). I'd start by figuring out which numbers really matter for the decisions you're making day-to-day.
Don't get obsessed with numbers that don't actually matter - like follower counts or page views when nobody's buying anything. Classic mistake is celebrating high traffic while your sales are trash. Also watch out for comparing weird time periods (like December to January, obviously those'll be different). Seasonal stuff throws everything off. I always ask "okay, so what does this actually mean?" after looking at any metric. Pick numbers that connect to real goals and look at them together, not alone. Oh, and set up proper baselines first - you need something to compare against or you're just guessing.
Yeah so marketing and finance track totally different stuff because they're after different outcomes. Marketing cares about engagement rates, leads, conversion funnels - you know, the squishy metrics that take time to show results. Finance? They want hard numbers. ROI, budget variance, cash flow. It's like comparing creativity to... well, math basically. Here's the thing though - both teams should connect back to revenue somehow, just through different paths. I'd say make sure their metrics actually align with the same business goals or you'll have people pulling in opposite directions. Makes sense?
Look at your last 6-12 months of data first - that's your baseline. From there, aim for maybe 10-20% improvement (honestly depends on your situation though). The key thing is making targets specific and measurable, but don't go crazy unrealistic or you'll just demoralize everyone. Get your team involved when you're setting these - they know what's actually doable day-to-day. Build in check-ins so you can tweak things if needed. Oh, and write down WHY you picked each number. Trust me, people always ask later and you'll forget your reasoning.
Dude, just track the stuff that shows where people get pissed off - response times, how often you actually solve their problems, satisfaction scores. Way better than guessing what's wrong. I swear, every time we push an update, our support tickets go crazy, so now we watch for those patterns. Pick like 2-3 things that really matter to your customers and obsess over them. Then when you make changes, check if they worked or if you're still screwing up. It's basically: measure, fix, measure again. Sounds boring but it actually works.
Honestly, just be super upfront about what you're tracking and why. People hate feeling spied on - I learned that the hard way at my last job lol. Tell them exactly how you'll use the data and who gets to see it. Watch out for biased metrics too, because sometimes they just highlight unfair stuff that was already there instead of actual performance. Get your team involved in figuring out what should be measured rather than doing it behind their backs. Oh and definitely spell out your data practices from day one. Trust goes a long way with this stuff.
Honestly, the trick is turning your data into an actual story with a beginning, middle, and end. Start with the "before" situation, then show the problem or opportunity your numbers uncovered. Walk through what changed, using real metrics as your plot points. I always use phrases like "here's what happened when..." or "the turning point was..." - makes boring spreadsheets feel human, you know? Connect each number to why it matters for business outcomes people actually care about. Oh, and pick one key metric to be your "hero" - it works surprisingly well.
-
I am a big fan of their newsletters because that is how I found my perfect requirement at the time of urgency. Thank God, I kept opening those.
-
I’ve been your client for a few years now. Couldn’t be more than happy after using your templates. Thank you!