


Smartphone sales dashboard decline sales companys smartphone equipment ppt information




Try Before you Buy Download Free Sample Product
 Impress Your
 Audience
 100%
100% Editable
 Save Hours
 of Time


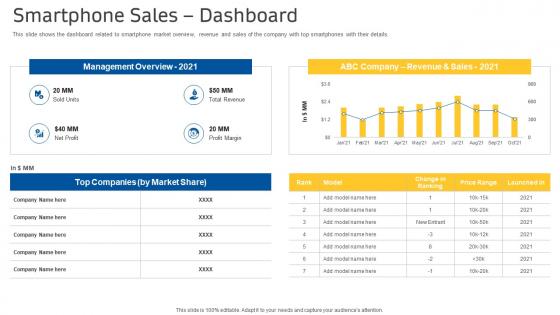
This slide shows the dashboard related to smartphone market overview, revenue and sales of the company with top smartphones with their details.
People who downloaded this PowerPoint presentation also viewed the following :
Smartphone sales dashboard decline sales companys smartphone equipment ppt information with all 7 slides:
Use our Smartphone Sales Dashboard Decline Sales Companys Smartphone Equipment Ppt Information to effectively help you save your valuable time. They are readymade to fit into any presentation structure.





FAQs for Smartphone sales dashboard decline sales companys smartphone
Essential KPIs for smartphone sales dashboards include revenue growth, unit sales volume, market share by model, average selling price, inventory turnover, and customer acquisition costs. These metrics enable sales teams to optimize pricing strategies, identify top-performing devices, and streamline inventory management, while retail chains and manufacturers find that tracking conversion rates ultimately delivers improved forecasting accuracy and competitive advantage.
Smartphone sales data can be visualized through interactive charts, heat maps, trend lines, geographic distribution maps, and comparative bar graphs that reveal seasonal patterns, regional preferences, and performance metrics. These visualization techniques enable sales teams to identify emerging market opportunities, track competitor positioning, and optimize inventory management, while executives can quickly assess revenue trends and make strategic decisions that enhance market responsiveness and drive competitive advantage.
Real-time data transforms smartphone sales dashboards by enabling instant inventory tracking, immediate sales performance monitoring, and rapid market trend identification. Through live data feeds, sales teams can adjust pricing strategies, optimize stock levels, and respond to customer demands within hours rather than days, ultimately delivering competitive advantage and maximizing revenue opportunities in the fast-paced mobile market.
Seasonal trends significantly impact smartphone sales through holiday surges, back-to-school periods, product launch cycles, and economic fluctuations, requiring year-over-year comparisons and trend indicators on dashboards. Effective representation includes seasonal overlays, monthly comparison charts, and predictive forecasting tools, with many retailers finding that visual trend lines and percentage variance displays enable better inventory planning and marketing optimization.
Key demographics include age groups, income levels, geographic regions, gender, education levels, and occupation categories. These segments enable retailers and manufacturers to identify high-performing customer groups, tailor marketing strategies, and optimize product positioning, with many companies finding that demographic analysis significantly enhances targeted campaigns and ultimately drives higher conversion rates.
**INPUT**: What tools or software are best for creating an intuitive smartphone sales dashboard? **OUTPUT**: Leading tools for smartphone sales dashboards include Tableau, Power BI, Looker, Qlik Sense, and Google Data Studio, each offering robust visualization capabilities and real-time data integration. These platforms streamline sales tracking by automating data collection, enhancing visual analytics, and enabling mobile accessibility, with many retail organizations finding that strategic dashboard implementation ultimately delivers faster decision-making and improved sales performance.
Customer feedback integration transforms smartphone sales dashboards through sentiment analysis tools, real-time review aggregation, feature preference tracking, and complaint categorization systems. These capabilities enable sales teams to identify trending concerns, correlate feedback with sales performance, and adjust pricing strategies accordingly, with many retailers finding that feedback-driven insights ultimately enhance product positioning and customer satisfaction rates.
Marketing campaigns significantly boost smartphone sales figures through targeted advertising, promotional pricing, seasonal launches, and influencer partnerships, with these activities creating immediate spikes in purchase volume. These strategic initiatives enhance brand visibility and customer engagement, with many technology companies finding that coordinated campaigns drive 20-40% increases in quarterly sales performance, ultimately delivering competitive advantage in increasingly saturated markets.
Geographic data enables smartphone companies to analyze sales performance by region, demographic patterns, market penetration rates, and competitor presence across different territories. Through mapping technologies and regional analytics, businesses can identify high-performing markets for expansion, underperforming areas requiring strategic intervention, and emerging opportunities, while optimizing resource allocation and tailoring marketing strategies, ultimately delivering targeted growth and competitive advantage.
Common pitfalls include overwhelming users with excessive metrics, using poor visual hierarchy, neglecting mobile responsiveness, and failing to align KPIs with business objectives. These design mistakes can confuse sales teams and reduce dashboard adoption, while strategic combinations of clear visualizations, intuitive navigation, and relevant performance indicators ultimately deliver actionable insights and enhanced decision-making capabilities.
Competitor analysis enhances smartphone sales dashboards by integrating market share data, pricing comparisons, feature benchmarking, and launch timeline tracking alongside internal sales metrics. This strategic combination enables organizations to identify market gaps, adjust pricing strategies, and optimize product positioning, with many technology companies finding that comprehensive competitive intelligence ultimately delivers better market timing and enhanced competitive advantage.
Best practices for updating smartphone sales dashboard data include establishing automated data feeds, implementing real-time synchronization protocols, scheduling regular refresh intervals, maintaining data quality checks, and creating backup verification systems. These approaches streamline operations by ensuring accuracy, minimizing manual errors, and delivering consistent insights, with many retail organizations finding that automated updates enhance decision-making speed while reducing operational overhead.
Predictive analytics uses historical sales data, market trends, seasonal patterns, consumer behavior metrics, and economic indicators to forecast future smartphone demand on dashboards. Through machine learning algorithms and statistical models, retailers and manufacturers can anticipate peak sales periods, identify emerging market opportunities, and optimize inventory allocation, ultimately enabling data-driven decision making and competitive advantage in rapidly evolving mobile markets.
A smartphone sales dashboard facilitates collaboration by providing shared visibility into lead conversion rates, campaign performance metrics, sales pipeline data, and customer acquisition costs in real-time. This unified view enables sales and marketing teams to align strategies, optimize resource allocation, and identify high-performing channels together, ultimately streamlining communication and delivering improved revenue outcomes.
Mobile optimization enhances smartphone sales dashboard accessibility through responsive design, touch-friendly interfaces, simplified navigation, and faster loading speeds. These improvements enable sales teams to access real-time data seamlessly across devices, streamline field operations, and make informed decisions remotely, ultimately delivering improved productivity and competitive advantage in increasingly mobile-driven sales environments.
-
Easily Editable.
-
Easily Editable.